With the deadline for unrestricted free agent signings counting toward the compensatory formula having passed a week ago, it’s time to take a look as to where the list of projected 2025 compensatory picks stands as of now.
Continue reading 2025 Compensatory Picks Update (5/6/2025) »Uncategorized
Fifth Year Option Outcomes
With the final outcomes in for this years option eligible rookies I thought it would be a good idea to do a quick look at how the option rates have fared since the NFL went to a fully guaranteed fifth year option starting with the 2018 NFL class. Here is the breakdown by pick range
| Range | Option Rate |
| 1 to 5 | 75.0% |
| 6 to 10 | 75.0% |
| 11 to 15 | 70.0% |
| 16 to 20 | 55.0% |
| 21 to 25 | 55.0% |
| 26 to 32 | 25.0% |
Inside the top 15 we essentially have a 75% hit rate with a majority of players being good enough to at least warrant a guaranteed fifth year salary. That number declines to 55% when we get into the 16 to 25 range of the draft. For the tail end of the draft things fall off a cliff with only a 25% exercise rate.
For what it is worth almost no individual pick is perfect. The 1st overall pick in the draft has had all the players have their options picked up. Pick 5, 7, 13, and 25 are the other ones to have a 100% hit rate. Picks 27 to 29 are the duds so far. The overall average is 57%. Just goes to show that nobody is close to perfect with the draft selection process.
Here is a breakdown by position.
| Position | Players | Option Rate |
| Tight End | 4 | 100.0% |
| Left Tackle | 9 | 77.8% |
| Wide Receiver | 15 | 73.3% |
| Int. D-Line | 11 | 72.7% |
| EDGE | 17 | 64.7% |
| Safety | 5 | 60.0% |
| Guard | 7 | 57.1% |
| Right Tackle | 7 | 57.1% |
| Quarterback | 17 | 52.9% |
| Cornerback | 15 | 40.0% |
| Linebacker | 13 | 30.8% |
| Running Back | 7 | 28.6% |
| Center | 1 | 0.0% |
While tight end has not been a record mover the few players selected have all have their contracts extended by a year. Of the higher quantity selections we have good returns on left tackles, receivers. interior defensive line, and pass rushers.
QB comes in at 52.9% which is below average and I would expect this to fall further in the future. These numbers are propped up by mistakes made with Baker Mayfield and Sam Darnold that I do not think will occur in the future. Corner is down at 40% while linebacker and running back are both around 30%. These are both terrible first round selections. They don’t offer the value upside to begin with and when you see the lack of options being exercised it shows how far below expectations these players have been.
Discounting Of Future NFL Draft Picks
We had a little discussion over the last few days about discounting of future draft picks. The consensus is that in the NFL when a team trades up and includes a future pick that pick should be discounted by a full round (i.e a 2nd round pick in 2025 would be valued as a 3rd round pick) due to the uncertainty of the future. I personally have never subscribed to that belief since a 2nd round pick regardless of when you get it is always going to be more valuable than a 3rd rounder. Normally I “discount” by giving the pick one of three values- pick 16, pick 25 or pick 32- regardless of what the team’s current record is. Maybe that is the wrong approach but I thought I would look at some of the data to see if there are dramatic changes that should force us to discount the pick more.
Draft to Draft Changes
This is the main reason that I hear about discounting the draft pick. We know exactly who is in this years draft and we know how good the player is. We do not know how good the rest of the draft is. To examine that a little further I looked at the 2nd contract value of every player drafted from 2011 to 2019 and broke down by round the annual value of the contracts. To account for salary cap changes each was valued by the leaguewide cap total four years down the line (i.e. the 2011 draft class percent would equal the total 2nd contract APY divided by 32 x the 2015 cap of $143.28 million). Due to Covid the 2021 cap that I am using is $198.2 million, the same value as 2020. While there are better ways to do this to take position out of the equation I think for the draft it is probably important to take positional availability into account. Here are the results by round.
| Year | Round 1 | Round 2 | Round 3 | Round 4 | Round 5 | Round 6 | Round 7 |
| 2011 | 6.0% | 3.1% | 1.7% | 1.4% | 1.2% | 1.0% | 0.5% |
| 2012 | 5.6% | 3.2% | 2.8% | 1.9% | 1.3% | 0.7% | 0.6% |
| 2013 | 3.7% | 2.9% | 2.9% | 1.2% | 1.0% | 0.7% | 0.5% |
| 2014 | 5.6% | 4.1% | 2.0% | 1.4% | 1.2% | 0.8% | 0.8% |
| 2015 | 2.0% | 2.9% | 1.9% | 1.8% | 1.3% | 0.4% | 0.7% |
| 2016 | 5.2% | 3.5% | 2.8% | 2.1% | 1.7% | 0.8% | 0.4% |
| 2017 | 6.2% | 3.1% | 2.7% | 1.5% | 1.3% | 0.6% | 0.3% |
| 2018 | 6.7% | 3.6% | 3.0% | 1.9% | 1.4% | 1.3% | 0.7% |
| 2019 | 6.8% | 2.6% | 2.7% | 1.6% | 1.2% | 0.7% | 0.3% |
| Average | 5.3% | 3.2% | 2.5% | 1.6% | 1.3% | 0.8% | 0.5% |
| StDev | 1.5% | 0.5% | 0.5% | 0.3% | 0.2% | 0.2% | 0.2% |
The quality of the draft year by year is pretty consistent especially in the later rounds. We see more variance in the early rounds but most of that is driven by two drafts. In the case of 2013 it was just a bad draft which is pretty rare since almost every other draft has had good results ranging from 5.6 to 6.8 percent of the future cap. This was a no QB draft and really had no great defensive prosects either. It was heavy on offensive tackles. That all drives the numbers down. It was a clear outlier draft. 2015 was way lower than I expected. This was due to a few factors. The two QBs at the top both flopped. You had two running backs taken top 15 and a bunch of players who did not do great near the end of the round. I never considered this as bad as the 2013 draft and I think if we valued this with contracts as a percentage of positional value at the time it would be better but when trading picks that to me is less important.
Overall, I think I would look at this as indicating no reason to really discount picks in the 4th through 7th rounds as those values have very low variance. I think I would look at rounds 2 and 3 the same as well as you would have a pretty steady forecast and at no time did that fall below the average for the next round. For the first round you have two drafts where the 1st round score was essentially equal to a 2nd round pick. Depending on what baseline you use I think that would indicate dropping the value of a 1st round pick from 16 (if using the middle of the round) to 23 or 24. If basing, strictly on a current year pick maybe a 20% drop.
Where Will a Future Pick Land?
This is a great question as we have no idea. Chicago got super lucky this year when the Panthers completely imploded in 2023. The Cardinals on the other hand did not since the Texans qualified for the playoffs in 2023. Here are the results of the teams change in wins based on four win ranges for teams.
| Prior Year Wins | Next Years Change | StDev | Better | Worse | Same |
| 0-4.5 | 3.4 | 2.80 | 83.7% | 10.2% | 6.1% |
| 5-7.5 | 0.76 | 2.89 | 51.5% | 33.0% | 15.5% |
| 8-10.5 | 0.44 | 2.75 | 40.4% | 42.6% | 17.0% |
| 11+ | -2.27 | 2.91 | 17.5% | 66.3% | 16.3% |
We have a lot more variance here than we have with the draft quality year to year and the variance is pretty consistent no matter where you started from the prior year. Bad teams generally improve the most and it is fair to assume that their pick a year from now will be lower than where they pick this year as almost all of the bad teams had a better record the next year. Most of the variance there is in the positive direction for change.
The teams in the middle, on average remain in the middle. It may be fair to say that their pick will be in the same range. If the team is good they are likely to see their record change for the worse. All things equal you should expect a better pick the next year.
I think I would still rather just lean toward discounting a pick by sticking it in the middle of the round, but if you wanted to use the current year’s record to set your baseline for a future pick it would probably be best to see where +4 or +5 wins would put the team in a draft (likely between 7 and 16). For the next two groups you will probably have an expectation of the middle of the round. For the playoff teams maybe around 20.
This is probably more useful to look at if the option on the table was a 1 this year vs a 1 the following year. The one is probably more valuable in the future from a current playoff team. It is less valuable for almost everyone else.
The Benefit of a Rookie Now?
There is always a lot of feedback that says how important it is to a “win now” team to draft now and that its better to have the player you want on the roster in 2024 rather than in a pick in 2025. The issue I would have with this is how much value does a rookie provide now? While there are exceptions such as CJ Stroud in 2023 most rookies take a year to develop and impact the game. While a good rookie may certainly benefit the team in some manner the major impact comes the following season.
So if, for instance, Joe Douglas, who is a clear hot seat GM, said I need another wide receiver in round 2 and will do whatever I can to get him to save my job you have to go back and look at the results of these players as rookies. Here are the summary stats of that position of all rookies from 2018 to 2023:
| Rec | Yds | Over 1,000 Yds | Over 800 Yds | Over 500 yds |
| 34.8 | 466.1 | 2.8% | 19.4% | 44.4% |
That isn’t a life save for any GM and it includes a good group of players such as DK Metcalf, Tee Higgins, AJ Brown, Deebo Samuel, Courtland Sutton, Michael Pittman, Christian Kirksey, and so on. Many of those players did account for the high end numbers but other than Brown they probably will not be productive enough as a rookie to even remotely come close to saving a job.
While every position is different the positions that often have the fastest results are linebacker and running back which tend to be the positions least likely to impact the outcome of a season.
My argument would be that the overly aggressive trade for a rookie to “win now” is one that a GM who anticipates being on the hot seat a year from now would be more justified to make since he may at least have an impact player on the roster in 2025 when his seat is burning hot.
Overall
I won’t get into the soft factors related to budget or anything like that but I can’t see the evidence of dropping a pick a full round based on the evidence. Drafts are more less equal in talent from year to year. We should never be drafting solely on position if the concern is positional variance unless we are talking QB or ultra high end EDGE rushers. Records year by year are pretty random but we at least have some rule of thumb guidance to evaluate the normal outcomes. It is rare a rookie impacts the game that much to save a job. In my opinion, a mid to late round valuation makes the most sense when looking at the picks from one year to the next but the general data is here for you to make your own conclusions as to why the NFL team should drop the value of a future pick by a full round the way they currently do.
The Salary Cap Costs and Value Added from the 2024 NFL Draft
With the 2024 NFL Draft in the books we now have a final estimate for rookie costs for each team this year. At the top of the list is the Arizona Cardinals whose draft class should cost the team an average of $25.892 million per year and account for $19.275 million in cap charges this year. The Commanders rank number two with an average of $21.738 million per year and $16.057 million in salary cap charges. At number three are the Bears at $19.315 million and $14.25 million in salary cap charges.
The teams with the cheapest draft class will be the Browns whose class will only average $7.392 million per year and will count for a low of $5.680 million. Detroit also moved a lot of parts and will come in at $9.622 million with $7.362 million counting on the cap this year. The Chiefs round out the bottom three with $10.515 million per year and $8.087 million in cap charges.
Teams will begin signing rookies ASAP but some teams may have to wait to sign their bigger players. The net impact on the cap for the Bucs this year is just $2.9 million but they have next to no cap room. They will open up $1.9 million in cap room on June 2nd, but that wont cover it so look for them to convert some salary to a bonus. The Seahawks will need about $3 million in cap room but only have $1.6 million in space putting them in a position to have to restructure some contracts. The Giants with $5.8 million in net rookie cap charges are the final team that has to open up cap space to sign all of their rookies. The Bills, Dolphins, and Falcons are the other teams that will be very tight against the cap following rookie signings. In the case of Miami and Buffalo they will open some space on June 2nd. Atlanta likely needs to restructure a contract.
The other angle to look at with the draft is how much value is created in the process which shows how much rookies are underpaid. The Commanders picks project to add the equivalent of $87 million in value per year despite the cost of just $21.7 million per year. Chicago, New England, and Arizona all added over $70 million in value to their teams via the draft.
The other thing that is fun to look at is how teams utilized their picks. What I did was for every position calculate the expected value for the player based on his position and then calculated the expected value for a blind pick. These numbers always skew heavily towards teams that draft a QB so the top team is Chicago with a 74.7% increase over the baseline value. New England, Denver, Atlanta, and Minnesota would be the rest of the top five.
What if we eliminate QB? Then Atlanta goes to the top with a 25.5% increase. They killed it early with the premium positions before going for the low value spots late. Miami and Cleveland did fine with the few picks they had. Denver and Indy wrapped up the top 5.
The worst draft went to the Raiders at 11% under the baseline value. This was driven by going tight end and guard early in the draft and then spending draft capital on safety, running back, and linebacker late. The Packers were at -5.3% with a run on linebackers, safeties, and running backs. When you consider that they got a boost by drafting a QB late, this was every bit as bad as the Raiders. The other teams with below the line numbers were the Texans, Bucs, Panthers, and Lions.
The following table has the numbers for each team. Clicking the header will sort the data.
| Team | Players | Total Value | APY | 2024 Cap | Projected Value | Baseline Value | Value Added | Value Added (no QB) |
| Cardinals | 12 | $103,569,696 | $25,892,426 | $19,275,909 | $75,189,165 | $67,356,624 | 11.6% | 11.6% |
| Commanders | 9 | $86,955,170 | $21,738,794 | $16,057,238 | $87,024,080 | $57,161,263 | 52.2% | 7.7% |
| Bears | 5 | $77,261,916 | $19,315,480 | $14,250,600 | $78,687,111 | $45,044,212 | 74.7% | 13.0% |
| Chargers | 9 | $75,284,554 | $18,821,140 | $14,207,743 | $49,442,300 | $44,822,861 | 10.3% | 10.3% |
| Patriots | 8 | $74,648,516 | $18,662,129 | $14,040,914 | $77,146,509 | $44,658,005 | 72.7% | 16.7% |
| Packers | 11 | $66,675,010 | $16,668,753 | $12,623,035 | $44,088,125 | $46,565,932 | -5.3% | -10.2% |
| Rams | 10 | $61,032,386 | $15,258,098 | $11,550,059 | $44,802,513 | $39,393,092 | 13.7% | 13.7% |
| Falcons | 8 | $60,570,294 | $15,142,575 | $11,451,996 | $67,485,956 | $40,696,012 | 65.8% | 25.5% |
| Bengals | 10 | $60,440,594 | $15,110,149 | $11,487,701 | $46,622,523 | $41,276,429 | 13.0% | 13.0% |
| Vikings | 7 | $59,160,740 | $14,790,185 | $11,175,071 | $56,703,887 | $34,676,259 | 63.5% | 15.4% |
| Titans | 7 | $57,248,032 | $14,312,008 | $10,834,897 | $38,156,148 | $33,793,660 | 12.9% | 12.9% |
| Giants | 6 | $56,759,114 | $14,189,780 | $10,602,023 | $37,741,686 | $35,987,626 | 4.9% | 4.9% |
| Colts | 9 | $56,421,282 | $14,105,322 | $10,782,342 | $46,269,846 | $39,445,517 | 17.3% | 17.3% |
| Eagles | 9 | $55,871,860 | $13,967,966 | $10,680,595 | $39,741,587 | $38,677,111 | 2.8% | 2.8% |
| Jaguars | 9 | $54,831,672 | $13,707,918 | $10,520,085 | $44,129,005 | $38,067,655 | 15.9% | 15.9% |
| Raiders | 8 | $54,394,484 | $13,598,622 | $10,314,143 | $32,457,331 | $36,452,512 | -11.0% | -11.0% |
| Bills | 10 | $52,446,934 | $13,111,734 | $10,125,349 | $39,292,663 | $37,050,926 | 6.1% | 6.1% |
| Ravens | 9 | $51,142,510 | $12,785,629 | $9,827,548 | $39,207,716 | $34,455,487 | 13.8% | 6.1% |
| Seahawks | 8 | $48,473,630 | $12,118,408 | $9,366,188 | $36,106,355 | $33,621,167 | 7.4% | 7.4% |
| Cowboys | 8 | $48,285,956 | $12,071,491 | $9,075,602 | $36,571,400 | $32,918,009 | 11.1% | 11.1% |
| Jets | 7 | $48,056,426 | $12,014,107 | $9,151,550 | $35,284,798 | $30,302,232 | 16.4% | 3.6% |
| Saints | 7 | $47,727,532 | $11,931,883 | $9,074,707 | $37,340,160 | $30,474,943 | 22.5% | 8.0% |
| Steelers | 7 | $47,168,640 | $11,792,161 | $8,848,002 | $35,038,219 | $34,726,522 | 0.9% | 0.9% |
| Texans | 9 | $46,950,182 | $11,737,547 | $9,013,871 | $30,137,481 | $31,255,679 | -3.6% | -3.6% |
| 49ers | 8 | $46,921,196 | $11,730,300 | $9,001,061 | $35,507,864 | $33,266,151 | 6.7% | 6.7% |
| Broncos | 7 | $46,311,308 | $11,577,828 | $8,858,471 | $51,494,289 | $30,546,263 | 68.6% | 17.5% |
| Buccaneers | 7 | $45,178,822 | $11,294,707 | $8,471,794 | $30,702,237 | $31,810,860 | -3.5% | -3.5% |
| Panthers | 7 | $44,283,042 | $11,070,761 | $8,407,980 | $31,165,428 | $31,870,011 | -2.2% | -2.2% |
| Dolphins | 7 | $43,538,526 | $10,884,632 | $8,342,274 | $34,494,873 | $28,930,730 | 19.2% | 19.2% |
| Chiefs | 7 | $42,061,498 | $10,515,375 | $8,087,299 | $29,234,988 | $27,965,828 | 4.5% | 4.5% |
| Lions | 6 | $38,488,008 | $9,622,003 | $7,361,880 | $26,502,509 | $26,809,614 | -1.1% | -1.1% |
| Browns | 6 | $29,571,600 | $7,392,900 | $5,679,861 | $23,160,362 | $19,599,911 | 18.2% | 18.2% |
Valuing the 2nd Round Trades of the 2024 NFL Draft
With the second round of the 2024 draft in the books I wanted to go and look at the seven trades that were made during the draft. For each trade I am evaluating the trade using the Fitzgerald-Spielberger draft chart. The chart which Brad and I created is based on past results of NFL drafts. These values are not going to be indicative of typical trade markets in the NFL but they do provide you the expected returns on each trade when you wind up with the average outcome.
For each trade we calculate points for each draft pick. I am valuing a future pick as the last pick in that particular round, which is the worst possible scenario for a team receiving a future pick and best possible scenario for a team trading it away. The difference between these two is the implied cost of the trade. That cost can then be translated into a single draft pick.
The expected value added for a team is what that draft slot would project at if we translated the rookie performance into veteran contract value (i.e. a QB selected number 1 in the draft would expect to bring a team a value of $50.4M, essentially projecting as one of the top 5 players at the position). The value lost is what the picks the team traded away would be valued as. For the team trading up the value will be specific to the position they traded up for. For the team trading down it will be a blind trade since there is no guarantee on positional availability. The difference is how much was gained or lost by moving up rather than picking blind.
7. Chargers Select WR Ladd McConkey
Implied Cost: 68 points (Less than the last pick in the draft)
Potential Salary Lost: ($2,545,065)
| Selection | Points | Expected Value Added | Traded Picks | Points | Expected Value Lost |
| 34 | 1,213 | $11,101,435 | 37 | 1,170 | $7,813,575 |
| 137 | 507 | $3,383,678 | 110 | 618 | $4,126,473 |
| Total | 1,720 | $14,485,114 | 1,788 | $11,940,048 |
There was a trend in the 2nd round today of teams making some very fair trades using more modern rather than traditional valuation methods and this was one of those deals. The Chargers moved up a few spots to grab a premium position that on average would produce an $11.1 million per year receiver and the odds are in favor of wide receivers in this round so it probably should be higher than that. The move up was basically a mid draft pick swap with the Patriots getting 110 for 137.
While the salary here skews in the favor of the Chargers that does not make this a bad trade for New England as he was not a player they valued. They pick up some higher upside with pick 110 and a little better contract at 37.
6. Chiefs Select OT Kingsley Suamataia
Implied Cost: 92 points (Less than the last pick in the draft)
Potential Salary Lost: $366,685
| Selection | Points | Expected Value Added | Traded Picks | Points | Expected Value Lost |
| 63 | 900 | $6,264,518 | 64 | 892 | $5,959,250 |
| 211 | 288 | $1,922,197 | 173 | 388 | $2,594,150 |
| Total | 1,188 | $8,186,714 | 1,281 | $8,553,400 |
Is there a point to moving up one slot in the draft? Probably not, but it is human nature to fall in love with certain players and when the player is this close it is normal to want to ensure you get the player. If you are going to make that kind of trade this is the way to do it. So many teams would just throw in pick 173 and call it a day, but negotiating to get another late pick back is smart and limits the upside that is being sent to the other team. A very fair trade for the two teams involved.
5. Eagles Select CB Cooper DeJean
Implied Cost: 54 points (Less than the last pick in the draft)
Potential Salary Lost: $500,690
| Selection | Points | Expected Value Added | Traded Picks | Points | Expected Value Lost |
| 40 | 1,131 | $7,406,920 | 50 | 1,018 | $6,794,629 |
| 78 | 792 | $5,289,803 | 53 | 988 | $6,597,446 |
| 152 | 454 | $3,032,080 | 161 | 425 | $2,837,418 |
Quite frankly I am not sure if we will see a fairer deal than this when discussing a jump of more than a few draft slots. Philadelphia jumps 10 spots to get their targeted corner and basically swap 53 for 78 and 161 to jump to 152. A super fair trade that fits what both sides are looking for in a draft and even the values here work out perfectly even.
The one thing that I was seeing online in heavy praise of the trade was the fact that DeJean had a first round grade and therefore this is a steal. There is a reason players fall so using pre-draft grades is really not a reason for giving “bonus points” to a trade.
4. Falcons Select DT Ruke Orhorhoro
Implied Cost: 330 points (The 194th pick in the draft)
Potential Salary Lost: ($741,798)
| Selection | Points | Expected Value Added | Traded Picks | Points | Expected Value Lost |
| 35 | 1,198 | $10,944,549 | 43 | 1,094 | $7,305,017 |
| 186 | 352 | $2,348,960 | 79 | 786 | $5,246,694 |
| Total | 1,550 | $13,293,510 | 1,880 | $12,551,711 |
This is an example of a trade where the position you select can mitigate the premium you pay. In this case the Falcons lost 330 points to the Cardinals, which is worth the same as the 194th pick, but when we plug in the value of a defensive tackle instead of a blind position, the Falcons actually gain in the trade. That makes a solid deal for both sides. The Falcons did a good job of getting ahead of the defensive tackle run which may have leveraged them further in the trade market though it sounds as if the player they selected was not close to a unanimous choice at this point.
In any case this is a solid trade for the Falcons and for the Cardinals a good way to gain a high probability of starting pick by going from 186 to 79 and Arizona’s roster is so barren they need starters. A win-win for both teams here.
3. Saints Select CB Kool-Aid McKinstry
Implied Cost: 697 points (The 90th pick in the draft)
Potential Salary Lost: $4,796,583
| Selection | Points | Expected Value Added | Traded Picks | Points | Expected Value Lost |
| 41 | 1,118 | $7,324,941 | 45 | 1,071 | $7,151,172 |
| 168 | 403 | $2,693,395 | |||
| 190 | 341 | $2,276,957 | |||
| Total | 1,118 | $7,324,941 | 1,815 | $12,121,524 |
New Orleans gains very little by jumping four spots and just throws two picks to the Packers to do it. Compare this to what the Eagles or Chiefs did above. Those teams worked to find trade packages that worked by continuously going pick for pick and that keeps the upside of having all of those multiple picks in place for the team trading up. This is just the “let’s get it done” trade probably because panic set in when the Eagles moved up for DeJean. There is far too much variance in the draft to put all of your faith in a 2nd round corner. This is a really solid trade for Green Bay who gets a few chances to land a contributor later in the draft.
2. Rams Select DT Braden Fiske
Implied Cost: 1,191 points (The 35th pick in the draft)
Potential Salary Lost: $5,143,428
| Selection | Points | Expected Value Added | Traded Picks | Points | Expected Value Lost |
| 39 | 1,143 | $10,443,668 | 52 | 998 | $6,661,906 |
| 155 | 444 | $2,965,940 | |||
| 64 | 892 | $5,959,250 | |||
| Total | 1,143 | $10,443,668 | 2,334 | $15,587,096 |
This came across like a complete panic move. Just a few picks earlier we saw the Falcons move up 8 spots for a negligible cost by using a pick swap, but here we get a jump of 13 and the Rams not only include 155 from this year, but a blind 2nd round pick in 2025. I get the team wanted a defensive tackle and the run on defensive tackles probably spooked the Rams, but you just can not make this trade for the fourth interior defensive lineman taken in the 2nd round. You have to at least get something back from Carolina in the trade to offset the cost of next year’s second rounder. Fiske will need to be a top 20 defensive tackle to justify the trade up and maybe he will be that but that is a low probability outcome.
In terms of value this was the 2nd worst trade of the draft behind the Vikings trade in the first round for Dallas Turner. The only reason it is not the worst of the 2nd round is because these same Panthers, who got a great deal here, completely flubbed the entire process a few picks later.
1. Panthers Select RB Jonathon Brooks
Implied Cost: 871 points (The 66th pick in the draft)
Potential Salary Lost: $8,058,011
| Selection | Points | Expected Value Added | Traded Picks | Points | Expected Value Lost |
| 46 | 1,060 | $4,832,209 | 52 | 998 | $6,661,906 |
| 142 | 489 | $3,262,374 | |||
| 155 | 444 | $2,965,940 | |||
| Total | 1,060 | $4,832,209 | 1,930 | $12,890,220 |
The Panthers went from landing one of the best possible trades in the 2nd round to making one of the worst trades around ten minutes later. The team moves up six spots to select a running back coming off an ACL injury making this a double whammy. By using the high pick on a running back they actually have less value than a blind pick at 52 where they would select a position that is more productive in today’s NFL. They throw in picks 142 and 155 to get up there to boot, giving the Colts access to some players who have a chance to be very productive if they get lucky with one of the picks.
I get that the QB was bad last year and one of the cliches we fall back on is “he needs a running game” but that just isn’t true. What the Panthers need are players and they just gave two of them away for picking a player that they should not be picking in the first place and one who likely would have been there at 52. It is hard for a 2nd round trade to have this kind of disparity in projected player impact with an $8 million gap between the projected value for a RB selected at 46 and all of these other picks. Brooks has to be a top five player to justify the trade and even then it is iffy since there are so many other important positions to select.
Valuing the 1st Round Trades in the 2024 NFL Draft
With the first round of the 2024 draft in the books I wanted to go and look at the five trades that were made during the draft. For each trade I am evaluating the trade using the Fitzgerald-Spielberger draft chart. The chart which Brad and I created is based on past results of NFL drafts. These values are not going to be indicative of typical trade markets in the NFL but they do provide you the expected returns on each trade when you wind up with the average outcome.
For each trade we calculate points for each draft pick. I am valuing a future pick as the last pick in that particular round, which is the worst possible scenario for a team receiving a future pick and best possible scenario for a team trading it away. The difference between these two is the implied cost of the trade. That cost can then be translated into a single draft pick.
The expected value added for a team is what that draft slot would project at if we translated the rookie performance into veteran contract value (i.e. a QB selected number 1 in the draft would expect to bring a team a value of $50.4M, essentially projecting as one of the top 5 players at the position). The value lost is what the picks the team traded away would be valued as. For the team trading up the value will be specific to the position they traded up for. For the team trading down it will be a blind trade since there is no guarantee on positional availability. The difference is how much was gained or lost by moving up rather than picking blind.
5. Chiefs Select WR Xavier Worthy
Implied Cost: 161 points (Less then the last pick in the draft)
Potential Salary Lost: ($2,168,388)
| Selection | Points | Expected Value Added | Traded Picks | Points | Expected Value Lost |
| 28 | 1,311 | $12,001,955 | 32 | 1,244 | $8,304,874 |
| 133 | 522 | $3,483,953 | 95 | 692 | $4,622,582 |
| 248 | 206 | $1,375,438 | 221 | 264 | $1,765,501 |
| Total | 2,039 | $16,861,346 | 2,200 | $14,692,957 |
The Bills trading down was smart, but the Bills making this trade seemed like a team just desperate to trade back in the first round. This is a no brainer trade for the Chiefs. By moving up a few spots they only gave up 161 points, which virtually means they gave up nothing by engaging in a bunch of pick swaps through the draft. By using the pick on a wide receiver rather than having a blind pick the expected player value actually plays out in the Chiefs favor by over $2 million. That is extremely rare for a non-QB trade.
About the only argument for the Bills to have made this trade was to gain another pick in the top 100. That does give them a better chance at finding a starter than at 133 but its definitely a higher variance area.
4. Panthers Select WR Xavier Legette
Implied Cost: 162 points (Less then the last pick in the draft)
Potential Salary Lost: ($2,618,302)
| Selection | Points | Expected Value Added | Traded Picks | Points | Expected Value Lost |
| 32 | 1,244 | $12,001,955 | 33 | 1,228 | $8,200,743 |
| 200 | 315 | $2,103,380 | 141 | 492 | $3,286,290 |
| Total | 1,559 | $14,105,335 | 1,720 | $11,487,032 |
Despite the fact that the Panthers come out even further ahead in salary than the Chiefs I ranked this one a little lower since there was probably little question that the Panthers would have been able to select Legette at 33. Perhaps the Bills asking for so little in return made Carolina fear another team could move up, but the trade seemed to be framed more as gaining an additional season of contract control via the option and quite frankly that is not a worthwhile consideration at this point in the round.
Buffalo clearly wanted to drop out. If we look at the two trades they made this effectively gets them back their late 4th they traded to the Chiefs and they save a little over $2.4 million in rookie salary by dropping from 32 to 33. From a financial perspective it is the smartest drop a team can make due to that. My assumption is Buffalo will be desperate to trade number 33 in round 2. Both of these Bills trades are really representative of how trades should work in the NFL but rarely do.
3. Lions Select CB Terrion Arnold
Implied Cost: 533 points (The 130th pick in the draft)
Potential Salary Lost: $3,727,836
| Selection | Points | Expected Value Added | Traded Picks | Points | Expected Value Lost |
| 24 | 1,389 | $9,102,861 | 29 | 1,294 | $8,637,998 |
| 252 | 198 | $1,321,293 | 73 | 826 | $5,513,992 |
| Total | 1,587 | $10,424,154 | 2,120 | $14,151,990 |
The hometown Lions made the move to grab the defender they wanted and wound up giving up 533 points to do it, giving up a very valuable pick in the top of the 3rd round. The value of that 3rd round pick really moves the needle in Dallas’ favor as they would be projected to select a player who would be worth $5.5 million a season.
My guess is the reason the Lions leaned into this trade is because they viewed the 3rd rounder as a bonus pick since it came via trade with the Vikings from the TJ Hockenson trade a few years back. Corners are harder to find as the draft goes on but when we are talking the 24th pick I am not sure it holds that much weight. The fact that Dallas used the pick on a tackle only made this more valuable for the Cowboys, dropping down a few spots to likely get the same position they had targeted at 24 and adding the 73rd pick in the process. If we factor in tackle versus a blind pick the move shifts to $4.4 million in the Cowboys favor.
2. Vikings Select QB J.J. McCarthy
Implied Cost: 619 points (The 109th pick in the draft)
Potential Salary Lost: ($14,440,847)
| Selection | Points | Expected Value Added | Traded Picks | Points | Expected Value Lost |
| 10 | 1,833 | $30,816,165 | 11 | 1,785 | $11,918,470 |
| 23 | 307 | $2,052,996 | 129 | 537 | $3,587,290 |
| 157 | 438 | $2,922,555 | |||
| Total | 2,141 | $32,869,162 | 2,760 | $18,428,315 |
Probably the most interesting trade of the first day. This was essentially a game of chicken between the Vikings and the Jets. The Jets had to convey to Minnesota that there was another team involved to make them move up one spot to grab the QB they wanted. The teams in this case were the Broncos and Raiders. Clearly the Broncos and Raiders were not offering a 3rd round pick along with their 1st rounder because the Jets weren’t getting anywhere near the Vikings 3rd rounder in this trade. From there you start looking at what they will and won’t take to drop down and these picks the Vikings gave up are ones the Raiders and Broncos could have beaten. The fact they did not tells me there was no market which works against the Vikings doing this trade.
On the other hand, this is a deep discount for trading up for a QB especially if you feel that there is a big drop from McCarthy to Nix. The most comparable recent trade up in this spot would have been the Bears going from 20 to 11 to get Justin Fields rather than having to settle for trying to get Mac Jones at a cheaper price. In that trade the Bears gave up the 20th pick, a future 1, a future 4, and a 5th round pick to jump 9 spots. That is a clear QB premium trade and was essentially like giving up the 5th overall pick to move up. It was made worse by the fact that the future pick they lost was the 7th overall pick rather than a late 1st round selection. So, in terms of who settled for less it was the Jets which is a benefit for the Vikings.
Overall, I think this is a win-win for both sides. I think the premium of a 109th pick is small potatoes to ensure that they did not get a last minute change of heart by the Broncos or Raiders. For the Jets they got bonus picks for selecting the same player they would have taken at 10. This is how trades should work in the NFL where the team moving up works hard to make sure they do not overpay the way the Bears did for a player who did not even make it to the fourth year with the team. The team moving down doesn’t really have other options because standing pat at 10 on “principle” is just dumb. Do what is in the best interest of your team and that is what both teams did here.
1. Vikings Select EDGE Dallas Turner
Implied Cost: 1,470 points (The 20th pick in the draft)
Potential Salary Lost: $5,557,739
| Selection | Points | Expected Value Added | Traded Picks | Points | Expected Value Lost |
| 17 | 1,564 | $14,700,653 | 23 | 1,411 | $9,422,419 |
| 167 | 406 | $2,713,598 | |||
| 96 | 687 | $4,587,147 | |||
| 131 | 529 | $3,535,227 | |||
| Total | 1,564 | $14,700,653 | 3,034 | $20,258,392 |
An absolute great trade for the Jaguars and complete head scratcher for the Vikings. The Vikings gave up in this specific trade (more on that in a minute) the equivalent of the 20th pick in the draft to move up 6 spots to take the 17th best player in the draft. That is absurd. Even if you want to factor in a few extra QBs taken than anticipated it is still the 14th or 15th best player. EDGE’s taken in this range in the post 2011 draft era include Will McDonald, Jaelan Phillips, maybe Zaven Collins (he was a pure tweener guy), Brian Burns, Marcus Davenport, Derek Barnett, Bruce Irvin (similar to Collins as a tweener), Quinton Coples, Ryan Kerrigan, and Robert Quinn. There are some good players there and some bad ones. Certainly nothing that screams it is a home run selection.
The trade itself gets even worse when you realize how the Vikings even got the 23rd pick to make this trade in the first place. The Vikings did a wild blind trade with the Texans in March to get to 23 and in return gave up the 42nd pick, a future 2nd, and the 188th pick in the draft. They also received the 232nd pick in the draft. Here is how the chart now looks if we substitute those picks for number 23.
Implied Cost: 2,163 points (The 5th pick in the draft)
Potential Salary Lost: $10,190,858
| Selection | Points | Expected Value Added | Traded Picks | Points | Expected Value Lost |
| 17 | 1,564 | $14,700,653 | 42 | 1,106 | $7,384,645 |
| 232 | 240 | $1,601,123 | 167 | 406 | $2,713,598 |
| 188 | 346 | $2,312,767 | |||
| 64 | 892 | $5,959,250 | |||
| 96 | 687 | $4,587,147 | |||
| 131 | 529 | $3,535,227 | |||
| Total | 1,804 | $16,301,776 | 3,967 | $26,492,634 |
I just don’t get any of the logic in any of this. The only reason to have done that first trade was to find a way to move up for a top 3 QB, which seemed like a longshot at best. The team traded a future 2nd, 3rd, and 4th rounder along with this years 2nd , 5th and 6th to get the 17th best player in the draft? This is now a no margin for error kind of trade. Turner has to be a major star, along the lines of a Burns or Josh Allen type of player, to justify what they gave up. Moving all of those pieces for one player rarely works out for a team, so the Vikings must really trust their process when it comes to identifying defensive talent to do this deal.
Premium Content: NFL Draft Summary Data
For those who are premium subscribers I put together a pdf file breaking down the contract results of the draft from 2011 to 2019 looking at results by round for each position, the best and worst performing teams, and who has taken the best approach to the draft the last few years. You can find the file under the “position reports” link in the “rosters” tab on the menu. Here is a brief preview of the report:
With the NFL Draft about to take place I thought we would do a new study using contract data to look at different ways to view the success and failures of drafting. To help do this I went back and looked at every draft from 2011 to 2019 and determined how much was spent on a per year basis on a rookie contract and how much was committed to a player on a post rookie contract. The ratio of 2nd to rookie contract value should give us an idea as to general expectations in each round as well as how much value teams receive by landing these low cost rookies who are generally underpaid in every year of their contract with the exception of the first year.
Overall Draft By Round
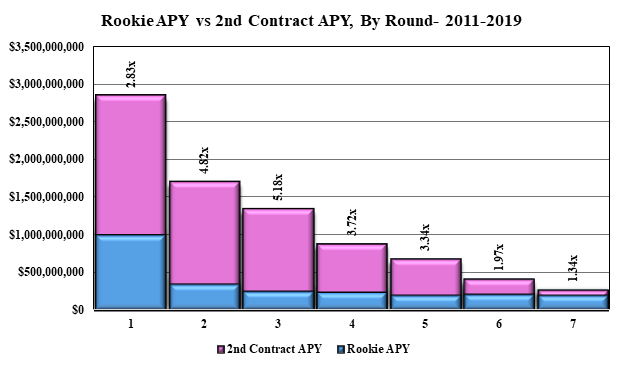
The results by round tell us a few things. First it is very clear that the general ranking of players in the NFL draft is pretty good. 1st rounders earned much more as a group than 2nd rounders who earned more than 3rd rounders and so on.
However, the total salary investment in round 1 is also very high relative to the other rounds which gives the round that many consider the “safest” in the draft, a high risk relative to the initial investment in the rookie contract. The 1st rounders salary is 2.83 times that of the rookie contract, which actually lags all but the last two rounds in “value”. You are paying up for that big potential even though rookie wages are depressed….