The other day I took a big picture look at rookie performance and how teams had performed from 2015 to 2020 and I wanted to expand on that a little bit to see if we could go back in time and try to put more focus on the rookie impact during those rookie years. To do this I went back and retroactively applied the second contract value for a draft pick to the team that drafted them/signed them as an undrafted player as the “player value” while he was a rookie.
To measure the direct impact I grouped rookies into three year bins for each team. Bin 1 would be rookies from 2011 to 2013, bin 2 is 2012 to 2014 and so on. We would then apply each bins value to a record in a given year, that is at least one year beyond the most recent draft class in the bin. Basically what that means is we would take bin 1 and say that that group of players directly impacted the teams record in 2014.
Just to give an illustration to explain it further here is the breakdown for bin 1. The players drafted in 2011 would be in their 4th year with the team, those from 2012 their 3rd year, and 2013 their 2nd year. By throwing out 2014 we are making the assumption that the 2014 classes direct impact is marginal. That may not be true and we could test that somewhat but for a first run through the analysis this should work ok.
Finally, to normalize the data a little bit I inflated each bins value to a $198.2 million cap which was the salary cap in 2020. While this is not the perfect way to really value contracts since the market for most positions is by no means pegged to the salary cap it is the quickest and gives fair values.
Much like the run where we looked at recent performance the impact of good draft picks is clearly important and much more so than the impact of free agents which usually does not lead to anything positive long term and in many cases not anything short term either.
We often measure success in the NFL based on playoff appearances and our typical threshold for success is 10 or more wins. I broke down the groups in above average drafting (approx. $96.5M in value for the three years of players) and below average drafting and then looked at the wins for each group. Here were the results over the five year period.
| Draft Value | 12+ wins | 10 to 12 wins | 8 to 10 wins | 5 to 8 wins | Under 5 wins |
| Over Avg. | 20 | 20 | 16 | 19 | 5 |
| Under Avg | 3 | 11 | 16 | 32 | 18 |
These are pretty damning numbers for teams that draft poorly and try to overcome it through alternate means like trades and free agent signings. 50% of the top drafting clubs wound up with at least 10 wins while over 60% of the poor teams wound up with a losing record.
As for the good teams who didn’t perform well in the draft- the high end teams were the quarterbacked by Ben Roethlisberger (2017), Carson Palmer (2015), and the MVPesque miracle season for Carson Wentz (2017). The 11 teams close to high end featured Andrew Luck (2014 and 2018), Palmer (2014), Roethlisberger (2016), Aaron Rodgers (2016), Russell Wilson (2016), Cam Newton (2017), Drew Brees (2017), and Tom Brady (2018). The other two were Ryan Tannehill (2016) and Ryan Fitzpatrick (2015). While both had good years nobody would consider those two high end QBs but the others were likely covering up flaws from bad drafts. Basically it is high end QBs making up for the level of play. Brady would probably show up multiple times on the list if we took out Garoppolo and Brissett from the mix as they had no value to the team winning but made up most of their drafting success.
Among the teams with good draft performance and over 12 wins you do get sneak ins by players like Andy Dalton (2015), Brock Osweiler and broken down Peyton Manning (2015), Alex Smith (2016 and 2018), Derek Carr (2016), Case Keenum (2017), Mitch Trubisky (2018), and Jared Goff (2018). You can include the Cowboys QBs in that mix a few times too if you want to have that debate. When you move the needle down further you include Joe Flacco (2014 and part of 2018), Nick Foles and Mark Sanchez (2014), Matt Stafford (2014), Smith (2015 and 2017), Teddy Bridgewater (2015), Eli Manning (2016), Blake Bortles (2017), Goff (2017), rookie Lamar Jackson (part of 2018). You can argue the pros and cons of some of these players but these are more the occasions where you can get by with a mid grade QB for a year or more when the draft quality helps out.
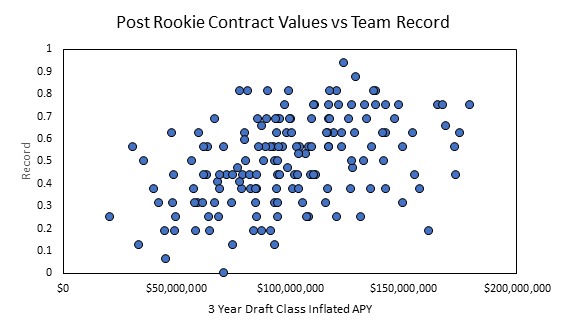
As for the best draft classes that is hard to say because of the way the QB position is valued. For instance the best run on drafts that we saw was the 2011 to 2013 Broncos but part of that number is inflated by Osweiler who did not contribute at all to that team. The same goes for the Jaguars in from 2014 to 2016 with Blake Bortles. That would leave the 2015 Rams as potentially the best of the bunch with their draft from 2012 to 2014. The Rams really were the team that did the least with some great drafts in that period and were sunk by the Shaun Hill, Austin Davis, Nick Foles types at QB. Here is the big list of teams with their record and inflated draft value.
| TEAM | YEAR | Draft Classes | Win Pct | Inflated Rookie Value |
| Broncos | 2014 | 2011 to 2013 | 0.750 | $179,687,673 |
| Jaguars | 2017 | 2014 to 2016 | 0.625 | $174,922,300 |
| Rams | 2015 | 2012 to 2014 | 0.438 | $173,517,228 |
| Cowboys | 2017 | 2014 to 2016 | 0.563 | $172,960,556 |
| Bengals | 2014 | 2011 to 2013 | 0.656 | $168,846,282 |
| Raiders | 2016 | 2013 to 2015 | 0.750 | $167,699,427 |
| Seahawks | 2014 | 2011 to 2013 | 0.750 | $165,635,789 |
| Jaguars | 2016 | 2013 to 2015 | 0.188 | $161,360,525 |
| Rams | 2014 | 2011 to 2013 | 0.375 | $157,344,939 |
| Raiders | 2015 | 2012 to 2014 | 0.438 | $155,443,182 |
| Chiefs | 2017 | 2014 to 2016 | 0.625 | $154,586,743 |
| Jaguars | 2015 | 2012 to 2014 | 0.313 | $150,132,350 |
| Ravens | 2017 | 2014 to 2016 | 0.563 | $149,965,756 |
| Patriots | 2015 | 2012 to 2014 | 0.750 | $148,101,288 |
| Rams | 2017 | 2014 to 2016 | 0.688 | $146,502,240 |
| Ravens | 2018 | 2015 to 2017 | 0.625 | $142,689,273 |
| Raiders | 2017 | 2014 to 2016 | 0.375 | $142,574,438 |
| Chiefs | 2016 | 2013 to 2015 | 0.750 | $142,442,618 |
| Vikings | 2016 | 2013 to 2015 | 0.500 | $141,774,846 |
| Cowboys | 2018 | 2015 to 2017 | 0.625 | $141,293,745 |
| Chiefs | 2018 | 2015 to 2017 | 0.750 | $137,981,091 |
| Saints | 2018 | 2015 to 2017 | 0.813 | $137,922,705 |
| Rams | 2018 | 2015 to 2017 | 0.813 | $137,132,142 |
| Texans | 2014 | 2011 to 2013 | 0.563 | $136,436,360 |
| Dolphins | 2015 | 2012 to 2014 | 0.375 | $135,861,341 |
| Texans | 2018 | 2015 to 2017 | 0.688 | $134,204,454 |
| Chargers | 2018 | 2015 to 2017 | 0.750 | $133,210,086 |
| Dolphins | 2014 | 2011 to 2013 | 0.500 | $132,816,353 |
| Rams | 2016 | 2013 to 2015 | 0.250 | $131,301,490 |
| Patriots | 2016 | 2013 to 2015 | 0.875 | $129,136,782 |
| Seahawks | 2015 | 2012 to 2014 | 0.625 | $128,743,958 |
| Panthers | 2014 | 2011 to 2013 | 0.469 | $127,763,086 |
| Ravens | 2016 | 2013 to 2015 | 0.500 | $127,715,926 |
| Bengals | 2015 | 2012 to 2014 | 0.750 | $127,613,383 |
| Dolphins | 2017 | 2014 to 2016 | 0.375 | $127,013,760 |
| Chiefs | 2015 | 2012 to 2014 | 0.688 | $126,052,046 |
| Panthers | 2015 | 2012 to 2014 | 0.938 | $124,178,026 |
| Packers | 2015 | 2012 to 2014 | 0.625 | $123,239,832 |
| Buccaneers | 2016 | 2013 to 2015 | 0.563 | $123,021,350 |
| Broncos | 2015 | 2012 to 2014 | 0.750 | $121,890,648 |
| Cowboys | 2016 | 2013 to 2015 | 0.813 | $120,802,285 |
| Cowboys | 2015 | 2012 to 2014 | 0.250 | $120,691,437 |
| Ravens | 2014 | 2011 to 2013 | 0.625 | $119,406,658 |
| Vikings | 2017 | 2014 to 2016 | 0.813 | $117,921,879 |
| Falcons | 2016 | 2013 to 2015 | 0.688 | $117,762,227 |
| Chiefs | 2014 | 2011 to 2013 | 0.563 | $117,376,474 |
| Vikings | 2015 | 2012 to 2014 | 0.688 | $117,368,623 |
| Patriots | 2014 | 2011 to 2013 | 0.750 | $117,330,525 |
| Bills | 2014 | 2011 to 2013 | 0.563 | $117,276,219 |
| Panthers | 2016 | 2013 to 2015 | 0.375 | $117,111,219 |
| Eagles | 2014 | 2011 to 2013 | 0.625 | $116,738,806 |
| Falcons | 2017 | 2014 to 2016 | 0.625 | $116,540,413 |
| Ravens | 2015 | 2012 to 2014 | 0.313 | $115,878,665 |
| Lions | 2015 | 2012 to 2014 | 0.438 | $111,584,427 |
| Cowboys | 2014 | 2011 to 2013 | 0.750 | $111,417,513 |
| Packers | 2014 | 2011 to 2013 | 0.750 | $110,963,437 |
| Panthers | 2018 | 2015 to 2017 | 0.438 | $110,609,305 |
| Titans | 2018 | 2015 to 2017 | 0.563 | $109,786,246 |
| Steelers | 2014 | 2011 to 2013 | 0.688 | $109,774,784 |
| Eagles | 2015 | 2012 to 2014 | 0.438 | $109,606,205 |
| Football Team | 2014 | 2011 to 2013 | 0.250 | $108,577,835 |
| Texans | 2015 | 2012 to 2014 | 0.563 | $108,492,644 |
| Texans | 2017 | 2014 to 2016 | 0.250 | $107,535,381 |
| Football Team | 2016 | 2013 to 2015 | 0.531 | $107,106,121 |
| Bears | 2017 | 2014 to 2016 | 0.313 | $105,838,800 |
| Football Team | 2015 | 2012 to 2014 | 0.563 | $104,391,143 |
| Vikings | 2018 | 2015 to 2017 | 0.531 | $104,266,398 |
| Bengals | 2018 | 2015 to 2017 | 0.375 | $104,058,356 |
| Football Team | 2017 | 2014 to 2016 | 0.438 | $103,728,623 |
| Titans | 2017 | 2014 to 2016 | 0.563 | $103,151,825 |
| Vikings | 2014 | 2011 to 2013 | 0.438 | $102,581,912 |
| Buccaneers | 2015 | 2012 to 2014 | 0.375 | $101,313,289 |
| Seahawks | 2018 | 2015 to 2017 | 0.625 | $101,086,623 |
| Lions | 2014 | 2011 to 2013 | 0.688 | $100,632,055 |
| Giants | 2016 | 2013 to 2015 | 0.688 | $100,387,123 |
| Patriots | 2017 | 2014 to 2016 | 0.813 | $99,887,459 |
| Cardinals | 2016 | 2013 to 2015 | 0.469 | $99,315,191 |
| Steelers | 2015 | 2012 to 2014 | 0.625 | $98,762,530 |
| Bears | 2018 | 2015 to 2017 | 0.750 | $98,021,197 |
| Texans | 2016 | 2013 to 2015 | 0.563 | $97,204,418 |
| Dolphins | 2018 | 2015 to 2017 | 0.438 | $95,679,783 |
| Steelers | 2016 | 2013 to 2015 | 0.688 | $95,556,527 |
| Seahawks | 2017 | 2014 to 2016 | 0.563 | $95,302,512 |
| Jaguars | 2018 | 2015 to 2017 | 0.313 | $95,069,449 |
| Falcons | 2015 | 2012 to 2014 | 0.500 | $95,000,229 |
| Packers | 2017 | 2014 to 2016 | 0.438 | $94,979,339 |
| Colts | 2014 | 2011 to 2013 | 0.688 | $94,945,251 |
| 49ers | 2018 | 2015 to 2017 | 0.250 | $94,818,902 |
| Packers | 2016 | 2013 to 2015 | 0.625 | $94,556,773 |
| 49ers | 2017 | 2014 to 2016 | 0.375 | $94,507,971 |
| Panthers | 2017 | 2014 to 2016 | 0.688 | $94,174,671 |
| Buccaneers | 2017 | 2014 to 2016 | 0.313 | $93,605,692 |
| 49ers | 2016 | 2013 to 2015 | 0.125 | $93,503,545 |
| Bills | 2015 | 2012 to 2014 | 0.500 | $93,366,195 |
| Chargers | 2014 | 2011 to 2013 | 0.563 | $93,191,256 |
| Giants | 2017 | 2014 to 2016 | 0.188 | $91,994,391 |
| Lions | 2016 | 2013 to 2015 | 0.563 | $91,990,060 |
| Eagles | 2017 | 2014 to 2016 | 0.813 | $90,395,613 |
| Cardinals | 2014 | 2011 to 2013 | 0.688 | $89,920,331 |
| Chargers | 2017 | 2014 to 2016 | 0.563 | $89,787,923 |
| Colts | 2015 | 2012 to 2014 | 0.500 | $88,881,800 |
| Bears | 2016 | 2013 to 2015 | 0.188 | $88,010,527 |
| Seahawks | 2016 | 2013 to 2015 | 0.656 | $87,758,421 |
| Eagles | 2018 | 2015 to 2017 | 0.563 | $86,380,522 |
| Patriots | 2018 | 2015 to 2017 | 0.688 | $86,039,716 |
| Falcons | 2014 | 2011 to 2013 | 0.375 | $85,663,605 |
| Falcons | 2018 | 2015 to 2017 | 0.438 | $85,596,786 |
| Jets | 2014 | 2011 to 2013 | 0.250 | $85,426,808 |
| Buccaneers | 2018 | 2015 to 2017 | 0.313 | $85,193,102 |
| Lions | 2018 | 2015 to 2017 | 0.375 | $85,146,586 |
| Browns | 2015 | 2012 to 2014 | 0.188 | $84,167,788 |
| Bears | 2015 | 2012 to 2014 | 0.375 | $82,977,344 |
| Football Team | 2018 | 2015 to 2017 | 0.438 | $82,626,672 |
| Steelers | 2017 | 2014 to 2016 | 0.813 | $81,789,593 |
| 49ers | 2014 | 2011 to 2013 | 0.500 | $80,765,111 |
| Steelers | 2018 | 2015 to 2017 | 0.594 | $80,548,950 |
| Dolphins | 2016 | 2013 to 2015 | 0.625 | $80,388,841 |
| Bengals | 2017 | 2014 to 2016 | 0.438 | $79,481,760 |
| Giants | 2015 | 2012 to 2014 | 0.375 | $78,862,518 |
| Packers | 2018 | 2015 to 2017 | 0.406 | $78,297,389 |
| Cardinals | 2015 | 2012 to 2014 | 0.813 | $78,066,953 |
| Browns | 2018 | 2015 to 2017 | 0.469 | $77,463,912 |
| Buccaneers | 2014 | 2011 to 2013 | 0.125 | $75,092,466 |
| Saints | 2014 | 2011 to 2013 | 0.438 | $74,957,105 |
| Chargers | 2016 | 2013 to 2015 | 0.313 | $74,751,027 |
| Browns | 2014 | 2011 to 2013 | 0.438 | $72,479,224 |
| Browns | 2017 | 2014 to 2016 | 0.000 | $71,095,843 |
| Lions | 2017 | 2014 to 2016 | 0.563 | $71,073,724 |
| Eagles | 2016 | 2013 to 2015 | 0.438 | $69,316,388 |
| Bills | 2018 | 2015 to 2017 | 0.375 | $69,210,612 |
| Chargers | 2015 | 2012 to 2014 | 0.250 | $69,006,191 |
| Bengals | 2016 | 2013 to 2015 | 0.406 | $68,418,593 |
| Broncos | 2017 | 2014 to 2016 | 0.313 | $67,140,547 |
| Saints | 2017 | 2014 to 2016 | 0.688 | $66,986,615 |
| Cardinals | 2018 | 2015 to 2017 | 0.188 | $64,939,581 |
| Jets | 2018 | 2015 to 2017 | 0.250 | $64,623,043 |
| Titans | 2016 | 2013 to 2015 | 0.563 | $64,092,368 |
| Bills | 2016 | 2013 to 2015 | 0.438 | $63,760,478 |
| Broncos | 2016 | 2013 to 2015 | 0.563 | $62,436,766 |
| Saints | 2016 | 2013 to 2015 | 0.438 | $62,428,682 |
| Jets | 2017 | 2014 to 2016 | 0.313 | $61,914,950 |
| Jets | 2015 | 2012 to 2014 | 0.625 | $60,072,804 |
| Bears | 2014 | 2011 to 2013 | 0.313 | $59,511,909 |
| Titans | 2015 | 2012 to 2014 | 0.188 | $58,562,235 |
| Jets | 2016 | 2013 to 2015 | 0.313 | $58,179,684 |
| Broncos | 2018 | 2015 to 2017 | 0.375 | $57,744,205 |
| Cardinals | 2017 | 2014 to 2016 | 0.500 | $57,105,930 |
| Colts | 2017 | 2014 to 2016 | 0.250 | $49,719,276 |
| Raiders | 2014 | 2011 to 2013 | 0.188 | $49,604,642 |
| Saints | 2015 | 2012 to 2014 | 0.438 | $49,209,938 |
| Giants | 2018 | 2015 to 2017 | 0.313 | $48,506,430 |
| Colts | 2018 | 2015 to 2017 | 0.625 | $48,303,980 |
| Browns | 2016 | 2013 to 2015 | 0.063 | $45,293,483 |
| Jaguars | 2014 | 2011 to 2013 | 0.188 | $44,874,417 |
| 49ers | 2015 | 2012 to 2014 | 0.313 | $42,423,534 |
| Giants | 2014 | 2011 to 2013 | 0.375 | $40,043,851 |
| Colts | 2016 | 2013 to 2015 | 0.500 | $35,944,828 |
| Titans | 2014 | 2011 to 2013 | 0.125 | $33,828,120 |
| Bills | 2017 | 2014 to 2016 | 0.563 | $31,118,587 |
| Raiders | 2018 | 2015 to 2017 | 0.250 | $20,896,566 |