In today’s look at the 2021 NFL season I wanted to share some of the roster development data that we maintain in the premium section of OTC where we look at the breakdown of teams by draft status and original signing status.
Homegrown Players
For the first big picture look we looked at every roster in the NFL and broke down their players into a “homegrown” or “non-homegrown” category. A homegrown player is defined as someone who was originally drafted by the team they are currently playing for or signed their first NFL contract with the team that they are currently playing for. This speaks to how well front offices have generally identified players that are a fit for their organization with some exceptions (at times a handful of teams would prefer to be bad with their own players rather than use free agency). Here is the breakdown for 2021.
| Team | Homegrown Players |
| Ravens | 79.4% |
| Cowboys | 75.0% |
| Vikings | 73.4% |
| Packers | 71.9% |
| Rams | 69.5% |
| Patriots | 67.2% |
| Saints | 66.1% |
| Colts | 64.1% |
| Seahawks | 63.2% |
| Chargers | 61.8% |
| Chiefs | 60.7% |
| Bengals | 60.3% |
| 49ers | 59.0% |
| Eagles | 59.0% |
| Steelers | 57.6% |
| Buccaneers | 57.4% |
| Falcons | 57.4% |
| Jaguars | 56.9% |
| Bills | 56.1% |
| Lions | 55.7% |
| Raiders | 54.2% |
| Titans | 53.8% |
| Panthers | 53.4% |
| Bears | 52.6% |
| Broncos | 52.4% |
| Browns | 51.6% |
| Dolphins | 50.8% |
| Football Team | 50.8% |
| Giants | 48.4% |
| Cardinals | 48.3% |
| Jets | 46.3% |
| Texans | 35.7% |
No surprise here with the Ravens at nearly 80% homegrown players on the roster this year. If I had to pick two surprising teams it was the Rams and Patriots, especially the Rams who have made so many trades recently.
By far the worst in the NFL is the Texans at 35.7%, more than 10% worse than the next closest team and over 20% less than the league average of 58.4%. When you look at the age of the team they are trotting out there little makes sense about anything they are doing. The Jets, Cardinals, and Giants are all under 50%.
Team Construction by Draft Round
We also broke every team down by original draft status of a player. Often you can get a glimpse as to how the individual teams approach on team building strategies and whether they like to focus on retaining/acquiring highly graded players or look more for the gems who were drafted later. First, here is the breakdown by round of the current NFL rosters.
| Round | % of Players |
| UDFA | 27.4% |
| 1 | 14.4% |
| 3 | 12.6% |
| 2 | 12.2% |
| 4 | 10.5% |
| 5 | 8.7% |
| 6 | 8.2% |
| 7 | 6.0% |
You can see where the lines have blurred a lot in the draft which used to see such a heavy focus on the first round. More and more teams use the top 100 as a guide and it reflects in how many players are on the rosters at the top of the draft. UDFA’s make up the most players in the NFL (not a surprise since there are only 32 picks in each round compared 200-300 UDFAs a year). Still the UDFA is making up nearly the same percentage of rosters as those round 5 to 7 players showing the importance of scouting.
Here is how each team has built the roster this year. Hopefully the table works to allow you to sort by the column header. Maybe we will try to make these a bit more interactive in the future.
| Team | Round 1 | Round 2 | Round 3 | Round 4 | Round 5 | Round 6 | Round 7 | UDFA |
| 49ers | 19.7% | 8.2% | 14.8% | 6.6% | 13.1% | 9.8% | 3.3% | 24.6% |
| Bears | 12.3% | 17.5% | 8.8% | 8.8% | 12.3% | 10.5% | 3.5% | 26.3% |
| Bengals | 10.3% | 15.5% | 12.1% | 8.6% | 12.1% | 13.8% | 8.6% | 19.0% |
| Bills | 15.8% | 8.8% | 10.5% | 8.8% | 12.3% | 7.0% | 10.5% | 26.3% |
| Broncos | 15.9% | 11.1% | 12.7% | 7.9% | 7.9% | 1.6% | 6.3% | 36.5% |
| Browns | 16.1% | 12.9% | 12.9% | 9.7% | 14.5% | 8.1% | 1.6% | 24.2% |
| Buccaneers | 16.4% | 18.0% | 9.8% | 9.8% | 6.6% | 9.8% | 6.6% | 23.0% |
| Cardinals | 17.2% | 17.2% | 12.1% | 8.6% | 6.9% | 6.9% | 6.9% | 24.1% |
| Chargers | 14.5% | 7.3% | 12.7% | 9.1% | 9.1% | 7.3% | 5.5% | 34.5% |
| Chiefs | 8.9% | 16.1% | 16.1% | 12.5% | 8.9% | 5.4% | 5.4% | 26.8% |
| Colts | 10.9% | 15.6% | 4.7% | 14.1% | 6.3% | 12.5% | 12.5% | 23.4% |
| Cowboys | 13.2% | 10.3% | 14.7% | 14.7% | 4.4% | 10.3% | 4.4% | 27.9% |
| Dolphins | 15.3% | 16.9% | 13.6% | 6.8% | 1.7% | 6.8% | 8.5% | 30.5% |
| Eagles | 14.8% | 13.1% | 9.8% | 11.5% | 4.9% | 14.8% | 3.3% | 27.9% |
| Falcons | 18.0% | 9.8% | 9.8% | 13.1% | 14.8% | 6.6% | 0.0% | 27.9% |
| Football Team | 13.6% | 6.8% | 8.5% | 6.8% | 11.9% | 8.5% | 15.3% | 28.8% |
| Giants | 20.3% | 15.6% | 12.5% | 10.9% | 4.7% | 9.4% | 9.4% | 17.2% |
| Jaguars | 13.8% | 19.0% | 12.1% | 12.1% | 8.6% | 1.7% | 8.6% | 24.1% |
| Jets | 13.4% | 7.5% | 11.9% | 13.4% | 10.4% | 16.4% | 0.0% | 26.9% |
| Lions | 13.1% | 4.9% | 11.5% | 13.1% | 8.2% | 3.3% | 4.9% | 41.0% |
| Packers | 14.0% | 12.3% | 12.3% | 8.8% | 12.3% | 7.0% | 8.8% | 24.6% |
| Panthers | 15.5% | 8.6% | 8.6% | 12.1% | 5.2% | 10.3% | 6.9% | 32.8% |
| Patriots | 10.9% | 10.9% | 15.6% | 7.8% | 15.6% | 7.8% | 6.3% | 25.0% |
| Raiders | 16.9% | 13.6% | 13.6% | 13.6% | 10.2% | 3.4% | 1.7% | 27.1% |
| Rams | 8.5% | 16.9% | 13.6% | 13.6% | 6.8% | 5.1% | 11.9% | 23.7% |
| Ravens | 19.0% | 6.3% | 19.0% | 9.5% | 6.3% | 7.9% | 1.6% | 30.2% |
| Saints | 14.5% | 8.1% | 17.7% | 6.5% | 0.0% | 4.8% | 6.5% | 41.9% |
| Seahawks | 10.5% | 17.5% | 10.5% | 10.5% | 14.0% | 8.8% | 5.3% | 22.8% |
| Steelers | 20.3% | 8.5% | 16.9% | 16.9% | 6.8% | 8.5% | 5.1% | 16.9% |
| Texans | 14.3% | 12.5% | 23.2% | 5.4% | 8.9% | 12.5% | 1.8% | 21.4% |
| Titans | 10.8% | 12.3% | 7.7% | 6.2% | 6.2% | 6.2% | 4.6% | 46.2% |
| Vikings | 10.9% | 10.9% | 14.1% | 18.8% | 7.8% | 9.4% | 6.3% | 21.9% |
The Steelers, Giants, 49ers and Ravens all have the most 1st rounders in the NFL while the Rams and Chiefs have the least. It as interesting look as many decent teams are not loaded with 1st round players on the roster. You will find many of those teams living in the 2nd and 3rd rounds.
The Titans have the most UDFAs in the NFL with the Saints and Lions rounding out the top 3. The Saints I would argue is a cap related thing while the Lions are rebuilding. The Titans is probably a bit cap related as well, though I would need to break things down more to see how many are actually on a rookie deal still. The Steelers and Giants are at the bottom of the NFL with the Bengals being the only other team under 20% which is surprising since I would have expected them to focus on that area.
Recent Draft Success- 2018 to 2020
Much of the fortunes of teams lies with how well they have performed in recent drafts. What I did here was look at every teams draft pick from 2018 through 2020 and determined the number of players who are still on the team. I then compared that to the baseline rate for each round. This can give us a better idea of how well a team does since a team with many top picks is expected to have all of the players on a roster while a team with many late picks is not.
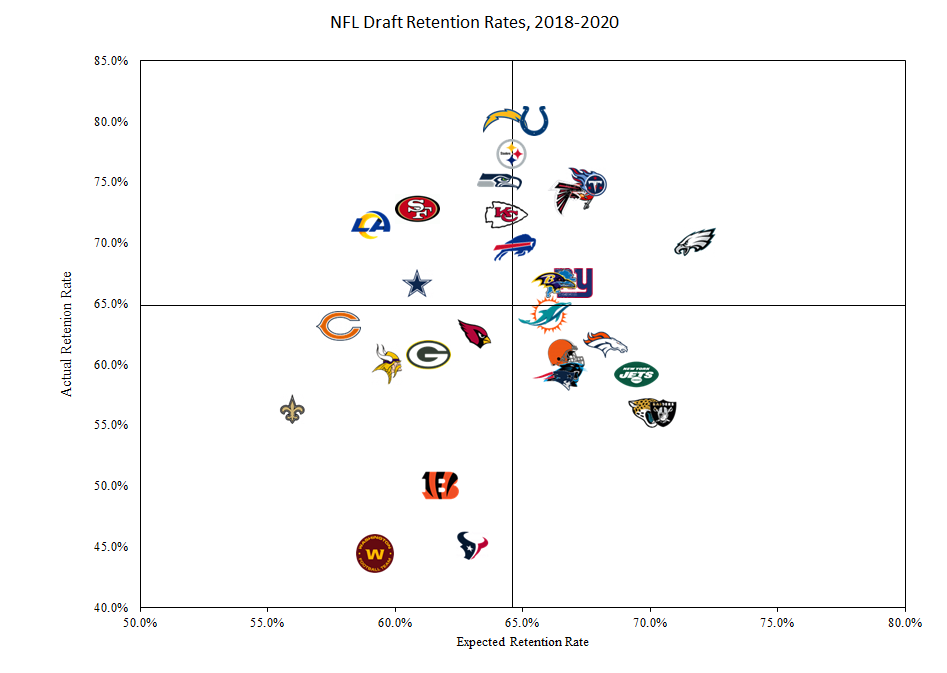
The top right quadrant are the teams that have basically drafted up to expectations. These are teams that should have a large number of players on the roster in 2021 from their 2018 to 2020 drafts and have many of them on the team.
The top left quadrant are the overachievers in the draft. These teams have retained more players than expected from their drafts.
The bottom left are the teams that did not really focus much on the draft the last few years. They had an expected low return from their drafts and got exactly that.
Finally, the bottom right is the underachievers. These are teams with great draft capital and poor results.
When just looking at the difference between the expected and the actual return the best drafting teams have been the Chargers, Colts, Steelers, Rams, 49ers, and Seahawks. Now this doesn’t mean the players are great just that the team has found a role for them and a reason to remain on the team.
The worst team is the Texans with an expected hit rate of 63% and an actual hit rate of 45%. They are followed by the Football Team, whose numbers were really hurt by Haskins and Guice, Raiders, Jaguars, Bengals, and Jets. Certainly not much success in this group the last few years.
Here are the numbers as a sortable table.
| Team | Picks | Expected on Roster | Actual on Roster | Hit Rate | Expected Rate | Difference |
| Chargers | 20 | 12.9 | 16 | 80.0% | 64.4% | 15.6% |
| Colts | 30 | 19.7 | 24 | 80.0% | 65.5% | 14.5% |
| Steelers | 22 | 14.2 | 17 | 77.3% | 64.6% | 12.7% |
| Rams | 28 | 16.5 | 20 | 71.4% | 59.1% | 12.3% |
| 49ers | 22 | 13.4 | 16 | 72.7% | 60.9% | 11.8% |
| Seahawks | 28 | 18.0 | 21 | 75.0% | 64.1% | 10.9% |
| Chiefs | 18 | 11.6 | 13 | 72.2% | 64.4% | 7.8% |
| Titans | 16 | 10.8 | 12 | 75.0% | 67.6% | 7.4% |
| Falcons | 19 | 12.7 | 14 | 73.7% | 66.8% | 6.9% |
| Buccaneers | 23 | 15.5 | 17 | 73.9% | 67.3% | 6.6% |
| Cowboys | 24 | 14.6 | 16 | 66.7% | 60.9% | 5.7% |
| Bears | 19 | 11.0 | 12 | 63.2% | 57.8% | 5.3% |
| Bills | 23 | 14.9 | 16 | 69.6% | 64.7% | 4.8% |
| Ravens | 30 | 19.9 | 20 | 66.7% | 66.2% | 0.4% |
| Vikings | 35 | 20.9 | 21 | 60.0% | 59.7% | 0.3% |
| Lions | 24 | 15.9 | 16 | 66.7% | 66.4% | 0.3% |
| Saints | 16 | 9.0 | 9 | 56.3% | 56.0% | 0.2% |
| Giants | 27 | 18.1 | 18 | 66.7% | 67.0% | -0.4% |
| Packers | 28 | 17.2 | 17 | 60.7% | 61.3% | -0.6% |
| Cardinals | 24 | 15.2 | 15 | 62.5% | 63.1% | -0.6% |
| Eagles | 20 | 14.4 | 14 | 70.0% | 71.8% | -1.8% |
| Dolphins | 25 | 16.5 | 16 | 64.0% | 65.9% | -1.9% |
| Browns | 23 | 15.4 | 14 | 60.9% | 66.8% | -5.9% |
| Broncos | 26 | 17.8 | 16 | 61.5% | 68.3% | -6.7% |
| Patriots | 29 | 19.2 | 17 | 58.6% | 66.2% | -7.6% |
| Panthers | 22 | 14.7 | 13 | 59.1% | 66.7% | -7.6% |
| Jets | 22 | 15.3 | 13 | 59.1% | 69.5% | -10.4% |
| Bengals | 28 | 17.3 | 14 | 50.0% | 61.8% | -11.8% |
| Jaguars | 25 | 17.5 | 14 | 56.0% | 69.9% | -13.9% |
| Raiders | 25 | 17.6 | 14 | 56.0% | 70.6% | -14.6% |
| Football Team | 27 | 16.0 | 12 | 44.4% | 59.2% | -14.8% |
| Texans | 20 | 12.6 | 9 | 45.0% | 63.1% | -18.1% |