For those who are premium subscribers I put together a pdf file breaking down the contract results of the draft from 2011 to 2019 looking at results by round for each position, the best and worst performing teams, and who has taken the best approach to the draft the last few years. You can find the file under the “position reports” link in the “rosters” tab on the menu. Here is a brief preview of the report:
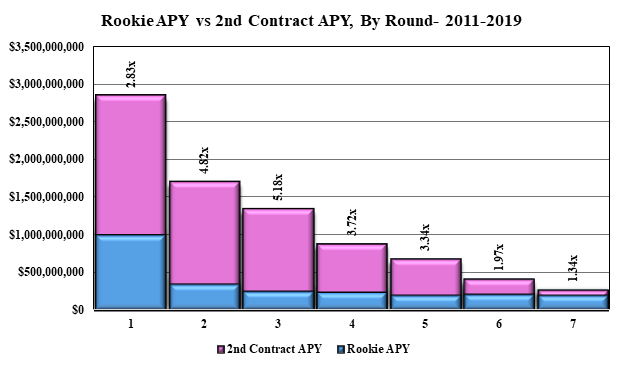
With the NFL Draft about to take place I thought we would do a new study using contract data to look at different ways to view the success and failures of drafting. To help do this I went back and looked at every draft from 2011 to 2019 and determined how much was spent on a per year basis on a rookie contract and how much was committed to a player on a post rookie contract. The ratio of 2nd to rookie contract value should give us an idea as to general expectations in each round as well as how much value teams receive by landing these low cost rookies who are generally underpaid in every year of their contract with the exception of the first year.
Overall Draft By Round
The results by round tell us a few things. First it is very clear that the general ranking of players in the NFL draft is pretty good. 1st rounders earned much more as a group than 2nd rounders who earned more than 3rd rounders and so on.
However, the total salary investment in round 1 is also very high relative to the other rounds which gives the round that many consider the “safest” in the draft, a high risk relative to the initial investment in the rookie contract. The 1st rounders salary is 2.83 times that of the rookie contract, which actually lags all but the last two rounds in “value”. You are paying up for that big potential even though rookie wages are depressed….
With only a few days before the 2024 NFL Draft, it’s that time again to take a look at how many undrafted free agents (UDFAs) each team might sign.
Team
Current Roster
Draft Picks
Projected UDFAs
Chargers
58
9
23
Ravens
61
9
20
Bears
68
4
18
Cowboys
65
7
18
Titans
65
7
18
Raiders
64
8
18
Bengals
62
10
18
Seahawks
66
7
17
Lions
66
7
17
Dolphins
68
6
16
Bills
64
10
16
Jets
68
7
15
Rams
64
11
15
Falcons
68
8
14
Vikings
67
9
14
Bucs
70
7
13
Jaguars
69
8
13
Panthers
70
7
13
Patriots
70
8
12
Saints
69
9
12
Browns
73
6
11
Giants
75
6
9
Broncos
73
8
9
Chiefs
74
7
9
Steelers
75
7
8
Colts
76
7
7
Texans
74
9
7
Comman-ders
74
9
7
Packers
72
11
7
Eagles
79
8
3
49ers
77
10
3
Cardinals
78
11
1
As always, the formula used to calculate these projections is simple: subtract from the maximum roster size (90) the number of players currently on the roster, and the number of draft picks each team currently has.
This season, the Chargers lead the way with an estimate of 23 UDFAs, largely due to having the fewest players under contract right now at 58. This is not too surprising given the major change at general manager and head coach with Joe Hortiz and Jim Harbaugh, as the team is likely to continue to change significantly with their arrival. Perhaps a little more surprising is the other team with a Harbaugh as the head coach in the Ravens, who unlike the Chargers have a coaching staff and front office that is highly tenured. A wide array of teams are bunched together afterward, with the Bears the most notable due to only having 4 draft picks right now–albeit two of them being the 1st and 9th overall picks.
On the other end, as it stands right now the Cardinals would have room for only one UDFA, with the 49ers and Eagles next up with only three spots for UDFAs. Something that most of the teams on the lower end have in common, however, is possessing a high number of draft picks. This is certainly the case with the Cardinals, who have garnered 11 of them right now, tied for most in the league. They are also second only to, oddly enough, the team with the fewest draft picks in the Bears, in draft pick value according to the Fitzgerald-Spielberger system.
Because draft day trades and other transactions will happen, these numbers will not be the final result. They may, however, give some hints as to what teams could do during and immediately after the draft. Teams with a high numbered UDFA potential could lower this number by acquiring more picks in this draft, either by trading down or trading away future picks. Teams with a low numbered UDFA potential could raise this number by trading up in this draft, or defer some picks into future drafts via trades, to lower the number of picks they make now. Teams on this low end are also more liable to cut some veterans currently on the roster.
Every year as the draft approaches I like to look at different trends over the last five years to see how teams can better utiltize the draft and free agency to build their football team by taking a bit of a more data based approach to player availability and success.
The first thing I did was go back to 2020 and look at the top 20 contracts at every position in the NFL. I then determined of those top 20 players how many of those players were available in free agency when they signed their most recent contract. This can give us a strong indication of good veteran players who a team can “buy” to become a starter.
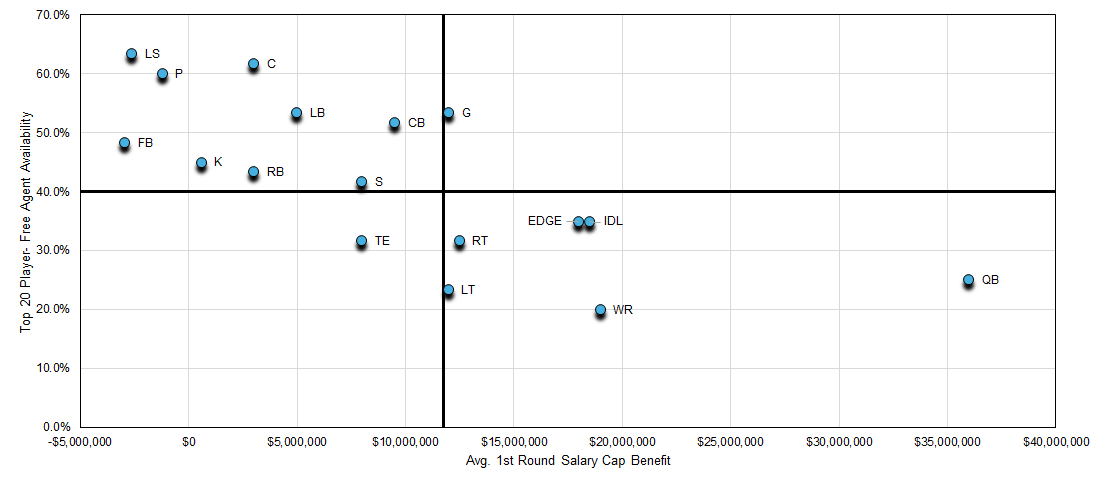
The second thing is to look at the contractual benefit that exists if we hit on a player in the draft. To do this I looked at what the 16th pick in the NFL draft will cost (about $4 million a year) and what annual savings that would provide over the 10th highest paid player at each position in 2024. Here are the results:
The positions in the bottom right quadrant are the positions that teams really should be focusing in the top rounds of the draft. These are positions with poor free agent availability along with massive contractual savings if the player hits. Those contractual savings are not just important for being able to “buy” players but they also give a safety factor to each pick.
For example a $4 million EDGE would be around the 59th highest paid EDGE in the NFL. That means that to justify his salary all he has to be is a situational type player. While that may be a disappointing outcome for a 1st round pick, the fact will be that the team is not losing money and/or cap room in the process. A linebacker, in comparison, would rank around 33rd meaning you need a borderline starter to justify the salary. Tight end would be 25th so that player has to be a starting quality player.
For whatever reason I think we have a hard time grasping the concept that sometimes drafting the “best available player” based on traditional scounting grades does not always equal building the best 53 man roster. When we discuss tight end vs wide receiver for instance the draft decision has a major bearing on the overall quality of the roster. If I draft a tight end at $4 million a year my team is saving about $8 million a year in salary cap charges if he hits. With that $8 million the team can buy someone like Zay Jones, Hollywood Brown, or Robert Woods.
If I draft the wide receiver and he hits I will save about $19 million. With that $19 million I can purchase someone like a Dalton Schultz or Noah Fant and still have $9 million or so to spend to maybe sign someone like Andre James at center or Blake Cashman at linebacker. You get more access to talent by selecting the premium position even if that player doesn’t grade as highly.
The top left quadrant are the positions that probably should never be drafted in the first round as these are the positions where we have free agent availability and limited salary savings. You can let someone else draft these players high and then sign them as free agents.
The two oddball positions are tight end and guard. Tight end has shifted in the last few years in terms of availability. While salaries remain stagnant and there is no salary benefit to drafting a tight end, more and more teams are extending their tight ends which makes them harder to buy in free agency. I am not sure if this is a byproduct of the low cost of the position or the trend that went on for a few years where tight ends switch teams after mediocre rookie contract runs and then play above their rookie levels. I would lean toward the latter because that cost has not changed the way we approach positions like safety.
Guard salaries have exploded and are now on par with the tackles. So there is a salary cap benefit to selecting a guard, however teams are allowing the players to hit free agency even though the markets view them as top players at the position. Neither position should be taken in the first round, but there is at least an argument that can be made.
I think it is also worth pointing out the cornerback position. Stagnant salaries have moved the position out of the aboave average cap savings category and teams continue to let their corners leave in free agency. I do believe in most cases a corners best years are years two through four or five and that is the reason why team’s are not going out of their way to extend their draftees. That can make this a position worth drafting but knowing it is a short term not long term solution.
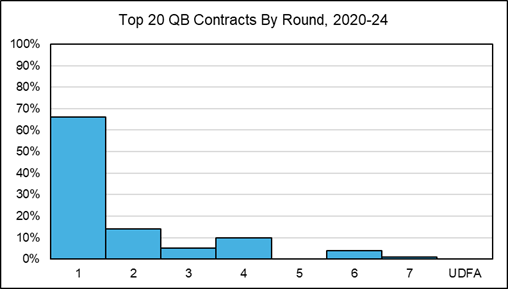
The other area that we need to look at when crafting a draft strategy is where do top players come from. For example if we look at QB it is pretty clear that drafting a player high is a risk you have to take. The average draft round in any given year for a top 20 paid QB is 1.8 and nearly 70% of the players are first round picks.
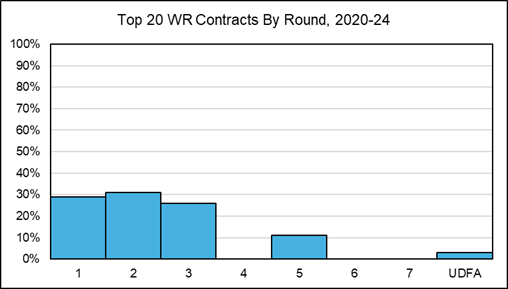
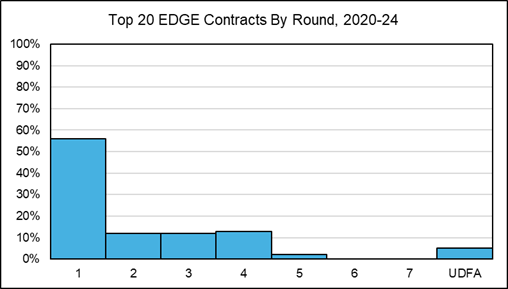
The round by round success is also a reason why you can justify devaluing the need to draft a wide receiver in the first round even though the original chart shows that selection as a better pick than an EDGE. Here is the receiver breakdown by round:
Now here is EDGE.
Basically by looking at past results we are bringing a 3rd dimension into the decision making process. We know that receiver is a position you have to draft due to lack of availability but it’s a position with talent in the first three rounds . EDGE has nearly 60% of the top players coming off the board in round 1 which is a reason to strongly weigh the pass rusher over the receiver in round 1 since we have seen so many very good receivers fall into the 2nd and 3rd rounds. .
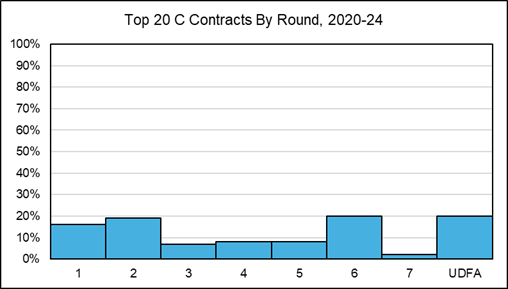
At the other end of the spectrum are positions like center where the average draft round is 4.4 and we can find higher level players in most rounds.
The positions that are just a waste to select in any round are the special teams positions where the average draft rounds of a top player are around the 7th round.
Here is the breakdown for the top 20 contracts looking at the average draft position and the breakdown by round of the draft from the last five seasons.
Position
Round 1
Round 2-3
Rd 4-7
UDFA
Avg. Round
QB
66.0%
19.0%
15.0%
0.0%
1.80
LT
61.0%
25.0%
12.0%
2.0%
2.10
EDGE
56.0%
24.0%
15.0%
5.0%
2.18
IDL
56.0%
31.0%
13.0%
0.0%
1.95
CB
48.0%
35.0%
6.0%
11.0%
2.43
RT
45.0%
29.0%
14.0%
12.0%
2.84
G
32.0%
47.0%
16.0%
5.0%
2.62
RB
29.0%
43.0%
18.0%
10.0%
2.97
WR
29.0%
57.0%
11.0%
3.0%
2.48
S
25.0%
44.0%
30.0%
1.0%
2.94
LB
24.0%
47.0%
25.0%
4.0%
2.96
TE
17.0%
41.0%
32.0%
10.0%
3.53
C
16.0%
26.0%
38.0%
20.0%
4.41
K
0.0%
0.0%
46.0%
54.0%
7.05
FB
0.0%
0.0%
35.6%
64.4%
7.21
P
0.0%
6.0%
50.0%
44.0%
6.43
LS
0.0%
0.0%
9.0%
91.0%
7.81
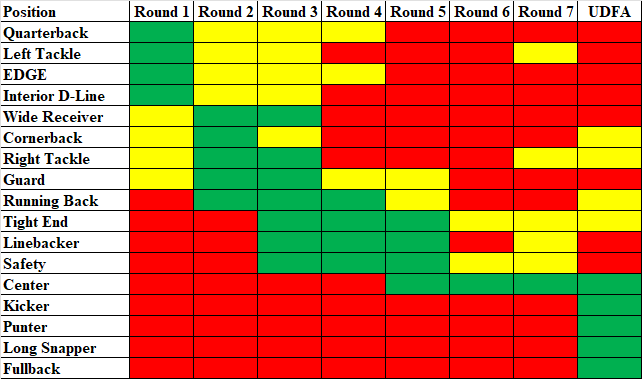
I think by putting it all together we can come up with some strategies as to where to focus in each round. For each position a green means a very good option for the round, yellow is one you can argue, and red means you should just avoid that position at that point.
As always there are going to be exceptions to everything and you can make what you want with the numbers but teams should be using these past results regarding availably, salary benefits of a draft pick, and rookie success by round and using that to optimize their approach to building a team. Avoiding these things and assuming that you will always hit big no matter who you draft and that the other parts will somehow magically come together even though there is little data to support finding those other parts in free agency is going to lead to a rough run for the organization.
Adding to the intrigue surrounding the Texans trade for wide receiver Stefon Diggs, the Texans have modified the Diggs’ contract, eliminating the final three years and giving Diggs a raise for the season.
Added incentive for Stefon Diggs: As part of the Buffalo-Houston trade, the Texans wiped out the final three years on Diggs’ contract, giving him the ability to become a free agent after this season, league sources tell ESPN. The Texans also took the $3.5 million guaranteed to… pic.twitter.com/3CdRZY0LhK
Diggs’ salary for the 2024 season will now be $22.52 million which will be fifth in the NFL. The salary will trail Michael Pittman ($28M), Calvin Ridley ($25M), Keenan Allen ($23.1M), and Mike Evans ($23M). Three of the four players all signed contracts this year which is the reason for the high salary with Allen being the lone player on an existing contract. Diggs will now be eligible for free agency in 2025.
It is an interesting move by the Texans. Diggs’ 2025 salary was not guaranteed and the raise he receives for 2024 represents an injury guarantee that he had in his contract for 2025. So this is a legit raise for Diggs. The move clearly indicated that the Texans did not view this new relationship as something that they see for the long term. While I am sure that the front office will give the typical lip service that “our goal is for the player to be here for the long term” the fact that they voided out the rest of the contract is usually what you do when you acquire a player and are trying to get the best possible year from him before moving on. With this happening so quickly it would seem that this was all discussed during trade talks in the last few days. It may also shed some light as to discussions about contract modifications that may have been going on Buffalo which also helped lead them to move on.
Do these contract tricks ever work to get a better performance from a player? Probably not but the Texans are hoping for the best and this probably sends a better message about their front office to other players in the league than having Diggs for one year and cutting him in 2025. The Texans cap situation in 25 with Diggs under contract was 26th worst in the NFL which probably made Diggs’ future cloudy at best and this should eliminate any distractions about Diggs’ future and contract. It is possible that the Texans used void years as part of the restructure to add a little extra cap room for this year. By voiding out Diggs’ contract the Texans will not be eligible for a compensatory pick for Diggs when he leaves in free agency so this has nothing to do with trying to recover draft capital.
Diggs’ manipulation of the Bills and Texans with this contract make this deal one of the all time great contracts for a player. The original contract extension signed in 2022 was largely done to help with the Bills salary cap and keep Diggs happy by making his salary come in line with recent contract extensions. The Bills paid Diggs an additional $20.9 million for the 2022 and 2023 seasons and now Diggs will earn $22.52 million. That works out to a one year extension worth $43.14 million, all of which was guaranteed.
$43.14 million is a crazy number for a contract. The current high for a receiver is $30 million a year which is a funny money contract. The real number is about $27 million a year. A one year new money $43.14 cash payment trails only Davante Adams who earned $43.36 million in his first year with the Raiders. As a frame of reference the franchise tag this year was $21.8 million, so Diggs basically doubled the tag with the way things went down. When we talk about business “Hall of Fame” Diggs has probably skyrocketed to the top with this one.
I thought in the coming weeks I would go over some of the contracts signed during free agency, share some thoughts on the deals, and see what if anything we can learn about the market going forward. I thought I would start with cornerback and see how things have gone so far for the position in 2024.
The overall market for corners remains soft. The top contract at the position was signed back in 2022 and the top five features no contracts signed in 2023 or 2024. The thought was maybe things would change this year as there were two franchise players in Jaylon Johnson and L’Jarius Sneed, but as things turned out neither really fit the profile of a true franchise player and wound up signing contracts that did not push the market outside of full guarantees at signing, where Sneed did set a new high water mark.
Really the area that showed some growth was at slot where Taron Johnson and Kenny Moore both hit new peaks for this group of corners. Still this has been a very hit or miss position where free agency, more often than not, is a negative for these corners and their highest value comes from their prior football team.
Here is the breakdown of the top 10 contracts signed this offseason (yards prevented is a metric I use to that calculates an expected net yards vs actual net yards):
Name
Team
Playtime
Yards Prevented
Years
Total
APY
Contract Rank
Full Guarantee
Pct. Guaranteed
Percent Participation
L’Jarius Sneed
Titans
91.1%
-329.7
4
$76,400,000
$19,100,000
7
$51,500,000
67.4%
4.0%
Jaylon Johnson
Bears
75.4%
-539.0
4
$76,000,000
$19,000,000
8
$43,800,000
57.6%
2.8%
Chidobe Awuzie
Titans
65.8%
57.9
3
$36,000,000
$12,000,000
14
$19,000,000
52.8%
4.3%
Taron Johnson
Bills
89.1%
-221.9
3
$30,750,000
$10,250,000
16
$17,825,000
58.0%
9.7%
Kenny Moore
Colts
92.9%
-203.4
3
$30,000,000
$10,000,000
17
$16,000,000
53.3%
5.1%
Sean Murphy-Bunting
Cardinals
65.8%
28.2
3
$25,500,000
$8,500,000
22
$14,195,000
55.7%
3.6%
Darious Williams
Rams
87.3%
-285.7
3
$22,500,000
$7,500,000
25
$7,000,000
31.1%
0.0%
Kendall Fuller
Dolphins
87.5%
-161.6
2
$15,000,000
$7,500,000
25
$7,975,000
53.2%
3.7%
Keisean Nixon
Packers
72.8%
-57.9
3
$18,000,000
$6,000,000
28
$6,500,000
36.1%
11.7%
Amik Robertson
Lions
58.7%
-51.1
2
$9,250,000
$4,625,000
34
$4,500,000
48.6%
0.5%
And here are the cash flows for each contract
Name
Team
Y1
Y2
Y3
Y4
L’Jarius Sneed
Titans
$25,000,000
$44,000,000
$60,000,000
$76,400,000
Jaylon Johnson
Bears
$28,000,000
$44,000,000
$60,000,000
$76,000,000
Chidobe Awuzie
Titans
$12,000,000
$24,000,000
$36,000,000
FA
Taron Johnson
Bills
$11,947,667
$20,707,667
$30,750,000
$30,750,000
Kenny Moore
Colts
$11,500,000
$20,000,000
$30,000,000
FA
Sean Murphy-Bunting
Cardinals
$10,000,000
$18,000,000
$25,500,000
FA
Darious Williams
Rams
$7,000,000
$15,000,000
$22,500,000
FA
Kendall Fuller
Dolphins
$8,000,000
$15,000,000
FA
FA
Keisean Nixon
Packers
$8,325,000
$13,000,000
$18,000,000
FA
Amik Robertson
Lions
$4,500,000
$9,250,000
FA
FA
Sneed and Johnson ranked 7th and 8th in the market and it seemed clear that Sneed’s contract was designed to just sneak past Johnson in annual value. Johnson wound up with a stronger cash flow this year and he and Sneed will earn identical amounts by the end of year 2 and year 3. So in this respect both contracts are essentially the same.
Sneed did get a better guarantee package with $51.5 million fully guaranteed at signing and Johnson did not receive a favorable vesting date on his 2026 salary so Sneed is basically locked in to earn at least $51.5 million even if things go badly as the Titans would be forced to pay him over $7 million in 2026. Johnson could be cut outright if things go badly. Sneed’s full guarantee is going to be good for the market though his contract does continue an alarming trend for players where teams are guaranteeing per game bonuses which is not a real guarantee.
That doesn’t make it bad for Tennessee it was just something they had to do to get a contract done. Teams will almost always trade guarantees for actual salary and this was the tradeoff. I think from a logical standpoint they can also look at a player like Darious Williams being released and signing for $7 million with the Rams and feeling confident that a $7.5 million guarantee is nothing more than opting into the market price for a player who is released.
Of the two I think the Bears probably got the stronger contract as Johnson was coming off a stronger season, has more of a draft pedigree, and the Bears were offered more than the Chiefs were in trade compensation, though that is not an apples to apples comparison since Johnson would have had one cheap year remaining if traded in 2023. Johnson got the stronger structure with the higher up front payment so if I was going to recommend a contract that was averaging $19 million a year I would probably prefer Johnson’s payout to Sneed’s.
There was a big drop to Chidobe Awuzie who signed for $12 million a year. It is a very straightforward deal where the player earns $12 million each season and it is similar to the contract with Sneed in which you can argue they are opting into a “cut” players salary in 2025 if things go south. This may be too bullish for a player who will be 29 this year and did not have a great 2023 season, but the Titans were spending money this offseason and this looks better now that they also signed Sneed.
The Taron Johnson and Moore contracts are nearly identical and will now be the standard for the position. It will be difficult to jump past both players but they should pull the market up by a few million. The teams did a good job of getting big per game bonuses here and Johnson will also have offseason workouts to attend to earn his entire contract.
The Murphy-Bunting contract was the head scratcher of the offseason. Health has been a concern with him and he has not been a big positive in coverage. This feels like a bet on draft status contract and should help pull players up. His $14.2 million in guarantees are more than double Williams and Nixon who signed for somewhat comparable APY’s. This is a great deal for him and a bad one for Arizona.
Williams contract feels like a good one for the Rams. It is always hard for players who are released from their contract to do well in free agency and I think that is the case here. Williams has about 1/3of his contract guaranteed at signing and I do not believe he received a 2nd year guarantee at signing which is usually a staple for the Rams.
The bottom three contracts are about what you would expect for the position with teams being cautious with the size and guarantees of the contract.
One that this is universal with the contracts this year is that almost everyone wound up with some type of salary tied to per game bonuses and workouts. About 4.5% on average of the contract is tied up in per game bonuses and attending workouts. In both cases I think this is due to a concern about health and a tendency to want to work out outside of the team in the offseason.
For the teams really pushing bigger per game bonuses everyone on the team (the Titans and Bills fall into this category) it really helps the teams push those per game bonuses on the players and it ends up being the mid tier and lower tier players who get a big percentage tied up in being healthy. This is an area where players probably need to fight more especially if you are being valued at the top of a subgroup of the position.
As the dust settles on free agency it seems clear that the market itself is not going to push forward until we get one of these players drafted high in the first round, like a Sauce Gardner who is extension eligible in 2025, to move the market. To be named a franchise player clearly is not enough nor is trading for someone who is a franchise player.
I do think as we look at the Murphy-Bunting deal and to a lesser extend the Awuzie deal there is going to be more of a push for players that should rank between 15 and 25 in salary to earn more than they have been over the past few years, bt even that will take some time to make a meaningful change to the market.
The unhappy marriage between the Bills and wide receiver Stefon Diggs has come to an end as the Bills have traded Diggs away to the Texans.
Blockbuster: Bills are finalizing a trade to send four-time Pro-Bowl WR Stefon Diggs to the Houston Texans for draft-pick compensation, sources tell ESPN. pic.twitter.com/5tIJGkve6t
The Bills extended Diggs in 2022 to a massive $24 million per year contract extension that came with $70 million in guaranteed money. Though Diggs was productive with 1,400 yards in 2022 and nearly 1,200 yards in 2023 there seemed to be issues right from the start with how Diggs felt he was being utilized and seemed to be almost an afterthought in the postseason. This likely winds up being a another in a long list of 3rd contracts that teams will wish they had back.
Diggs will carry $31.096 million in dead money for the Bills, a record for a non-QB by about $4 million. The prior record was for an in-season trade where salary was picked up by the team. The team will lose about $4 million in net cap space with the trade. Diggs was originally under contract in 2022 and 2023 and the new contract signed by the Bills wound up giving a raise of just under $20.9 million for those two seasons. They could have walked free and clear had they not signed the extension. Now they will have paid that extra money to come back with a 2nd round pick while also giving up a 6th and a 5th which makes this an incredibly expensive trade.
That said this was making the most of a bad situation by the Bills. Diggs’ salary was guaranteed for the year and there was no way for the team to really release him given their salary cap situation. They needed to find a trade partner and this is the best they could do. They will save $19.005 million in cash and now have him off the books for 2025 so they will be in an $19.005 million better position with the salary cap next season.
For Houston this gives them another potential dynamic fit in their offense if they can manage the egos. Diggs will cost $19.005 million this year and has a non-guaranteed salary of $18.505 million in 2025. $3.5 million of that salary is injury protected. There are also non-guaranteed years in 2026 and 2027 worth $19.6 million and $18 million respectively.
With the main part of free agency and the main wave of cuts and retirements now over I wanted to look to see what positions have shown growth in 2024 especially in light of the salary cap growing over 13% this past year.
Growth at the Top of the Market
When looking at the top five contracts at every position there was not a ton of movement at the top. This was to be expected as often the largest contracts are contract extensions and those contracts are the ones that are signed between May and September so there is plenty of time left to see the impact at the top. However, a few positions did stand out this year.
Guard saw the average of the top five players increase by 8.1% going from just under 18.5 million per year and nearly reaching $20 million per year. Number 2 was the interior defensive line which grew by 5.7% despite the retirement of Aaron Donald. The position is now averaging $26.25 million per year. Number 3 on the list was kicker which grew by 3.4%.
Not all was good at the top. The retirement of Jason Kelce saw the center market shrink by 4.2%. This will likely not recover during extensions as center has been devalued over the last few years. Left tackle fell by 3.7%. Health has been an issue which has led to cuts and more often renegotiations where the players are accepting pay cuts. This has a chance to bounce back during the summer. Linebacker also dropped by over 3% and that is similar to center with the de-valuation.
Growth in Players 6 Through 10
Seven positions grew by at least 3% during the free agency period. No surprise this was led by guard which is up 13% over 2023. This is a combination of new players in the top 5 along with few releases plus some new signings creating a new top 10. The interior d-line is up 7.4% for similar reasons to the guard position. Kicker was still number 3. This was the area for new wide receiver contracts with 5% growth while right tackle, edge, and punter all had growth over 3%.
Running back fell off a cliff and players were cut with the average annual salary falling 10.6%. Center dropped 9.2% as teams continue to cut back across the board. Safety ended up being a dud in free agency and we had some players cut so we saw a drop here of 7%.
Players 11 through 20
I usually feel that the salary cap changes often initially have a much bigger impact outside the top 10 and here we had seven positions with 8% or more growth. This was led by kicker which is up 29.1%. I think this is just slowly becoming no haggle negotiating where kickers ask for a salary around $3.5-$4 million a year and the teams just say fine. Not sure if this is good or not for teams given how many kickers in the NFL are good, but it’s terrific for kickers.
Guards are up 20.1% with the average salary of players 11 through 20 now over $11 million a year. Next up is punters though they are coming from a much lower starting salary. This makes little sense to me as punters should be like long snappers given the changes to the game. Edge rushers jumped 13% as teams are looking for value signings here rather than jumping straight into big contracts. Linebacker is up 11.3% as teams fought back against the bloated salaries we have seen in the past but are more than willing to work in the $8 million a year range. That is probably a fair tradeoff.
Left tackles dropped a whopping 33% falling to $8.5 million a year. In my opinion this is tied to all of those injuries I mentioned above and the lack of good left tackle play from higher priced backups. I think we are seeing more teams looking for low cost stop gaps and loading up with cheap draft picks rather than over-relying on the veteran players. Center is down 23.5% while safety is down 19%. The other position with a double digit drop is QB which is down 10% to $28 million a year.
Players 21 to 32
We finish our list with the last group of veteran “starters” with players 21 to 32. Guard just exploded off the board up 54% from $4 million to $6.2 million a year. It is a good time to be a guard and given these salaries I could see why some veterans may still get paid a decent number if they wait until after the draft to sign as a free agent. Linebacker is up 15% with long snapper up 7.7%.
We had five positions with a 10% or more decline. The center position continues its obliteration for 2024 as it is down 31.2% from last year. Left tackle is down 28.5% while corner is down 19.7%. Safety and Tight end are the other two.
All of the contracts here could see a boost over the summer. There are a handful of draft picks whose contracts will boost the averages at these positions and as extensions come in some of the existing contracts will slide down a level.
Still I was surprised that we did not see more of a boost in this contract range. I think the league is looking at a top 20 and then not seeing the value at many positions especially with the draft providing cheaper options with more upside.
The following two tables are the averages for each position in 2024 and the growth we saw from 2023. Clicking the header should let you sort each column.