Contract Analytics: Cordy Glenn | Terron Armstead | Josh Norman | Shawn Williams | Jordan Reed |Allen Hurns | Harrison Smith
Members of the NFL media will analyze this contract from a number of perspectives, each stressing that the face value of the contract is not determinative of the amount of money Cox will receive or the strength of the contract relative to other contracts, while at the same time highlighting certain pertinent contract characteristics. Many will note the amount of “total guarantees”, while others will focus on the “full guarantees at signing”. Others may highlight the amount of money that will be fully guaranteed as of a certain point in time (such as March 2017), while others will stress the annual cash flows. The analysis may include phrases such as “virtually guaranteed” or “practically guaranteed”, and the observations may note that “the contract is really $X over Y years, followed by Z team options.”
I do not disagree with any of this analysis. All of these contract characteristics are important to varying degrees and should be weighted in the analysis as appropriate. However, the degree of nuance in the contract makes it exceedingly difficult for any one person to synthesize all of the relevant information and articulate analysis that does not over-emphasize any particular characteristic. The best approach is to establish a framework for analysis that incorporates all of the considerations that one deems to be important to contract analysis, and to then apply that framework to all new contracts such that each is analyzed in a holistic, objective and consistent manner. This is the goal of Expected Contract Value:
| Fletcher Cox |
| Face Value: $110,399,000 |
| Year |
Salary |
Expected Outcome |
Expected Value |
Guaranteed |
| 2016 |
— |
99.8% |
— |
$27,299,000 |
| 2017 |
— |
99.4% |
— |
$9,000,000 |
| 2018 |
$11,500,000 |
99.0% |
$11,383,773 |
— |
| 2019 |
$15,600,000 |
94.9% |
$14,798,954 |
— |
| 2020 |
$13,900,000 |
69.2% |
$9,615,283 |
— |
| 2021 |
$16,000,000 |
48.8% |
$7,801,700 |
— |
| 2022 |
$17,100,000 |
32.2% |
$5,504,878 |
|
| Subtotal |
— |
$49,104,588 |
$36,299,000 |
| Expected Contract Value: |
$85,403,588 (77%) |
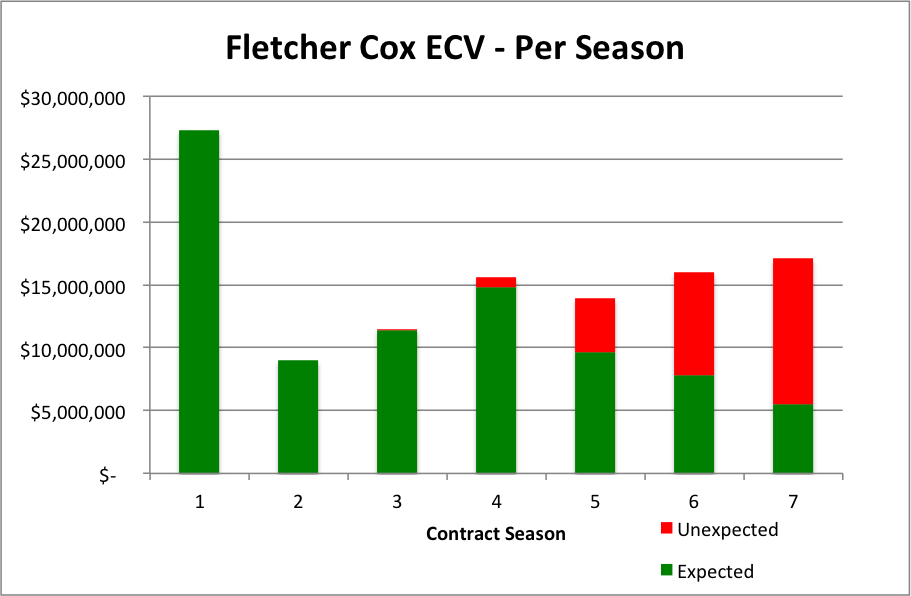
As the chart below shows, Fletcher Cox possesses the largest Expected Contract Value of any non-QB contract in the entire NFL. This contract contains all of the characteristics that drive a high Expected Contract Value. First, there is a large signing bonus, which provides significant dead money protection into the fifth contract season. Second, there is a fully guaranteed option bonus in the second contract season that provides additional dead money protection through the sixth contract season. Third, the contract includes impressive Accelerated Future Team Option Deadlines whereby the 2018 salary and half of the 2019 salary vest as fully guaranteed during the 2017 offseason, and the other half of the 2019 salary vests as fully guaranteed during the 2018 offseason. Because Cox is extremely likely to remain under contract into 2017, the Accelerated Future Team Option Deadlines produce a waterfall effect that greatly enhances the probability Cox will remain under contract through 2019.
Fourth, because the contract is an extension, the yearly cap numbers are less than the “new money APY” would suggest they might be, which provides Cox somewhat more of a buffer zone to suffer a performance decline before the team would determine that releasing him is a more efficient use of salary cap space. Fifth, the contract is not structured in a back-loaded fashion, which means there is a legitimate opportunity that the team will find Cox’s cap numbers in 2021-2022 to be reasonable, particularly once salary cap inflation is taken into account. Finally, Cox will only be 25 years old at the beginning of the 2016 season, and due to typical aging curves, younger players have a higher probability of remaining under contract longer, and in turn receiving a higher percentage of the face value of a contract.
| Player |
Length |
Face Value |
Expected Contract Value |
% Expected |
| Fletcher Cox |
7 |
$110,399,000 |
$85,403,588 |
77% |
| Marcel Dareus |
7 |
$103,160,000 |
$82,612,535 |
80% |
| Ndamukong Suh |
6 |
$114,375,000 |
$79,836,276 |
70% |
| Tyron Smith |
10 |
$109,718,013 |
$79,573,789 |
73% |
| J.J. Watt |
8 |
$108,876,385 |
$76,355,206 |
69% |
| Justin Houston |
6 |
$101,000,000 |
$75,795,857 |
75% |
| Olivier Vernon |
5 |
$85,000,000 |
$71,726,276 |
84% |
| Gerald McCoy |
8 |
$102,689,561 |
$68,426,424 |
67% |
| Malik Jackson |
6 |
$86,500,000 |
$63,936,945 |
74% |
To say that Cox possesses a very large Expected Contract Value is not necessarily to say that the contract is a bad one from the team’s perspective. The Eagles appear to have taken a large risk, but one can argue that this contract delivers a significant amount of surplus value to the team. We are not in a position to know what Intrinsic Value (the amount that the team would pay on a one-year, fully guaranteed contract) that the Eagles place on Cox, but for the sake of example let’s imagine that number to be $18 million in 2016. Using a conservative salary cap inflation rate of 5%, the team’s expected surplus value would look as follows:
| Season |
Estimated Intrinsic Value |
Salary Cap Number |
Potential Surplus |
Contract Expectation |
Expected Surplus |
| 2016 |
$18,000,000 |
$6,499,000 |
$11,501,000 |
99.8% |
$11,477,998 |
| 2017 |
$18,900,000 |
$9,400,000 |
$9,500,000 |
99.4% |
$9,443,000 |
| 2018 |
$19,845,000 |
$17,900,000 |
$1,945,000 |
99.0% |
$1,925,550 |
| 2019 |
$20,837,250 |
$22,000,000 |
-$1,162,750 |
94.9% |
-$1,103,450 |
| 2020 |
$21,879,112 |
$20,300,000 |
$1,579,112 |
69.2% |
$1,092,745 |
| 2021 |
$22,937,068 |
$17,200,000 |
$5,737,068 |
48.8% |
$2,799,689 |
| 2022 |
$24,121,722 |
$17,100,000 |
$7,021,722 |
32.2% |
$2,260,994 |
| Total |
|
|
|
$27,896,526 |
By this measure, the team incurred $36.3 million worth of risk in order to manufacture $27.9 million worth of upside, which would be a much better ratio than in the examples I calculated for Allen Hurns and Harrison Smith, although it is fair to argue that risk should include the guarantees affected by the Accelerated Future Team Option Deadlines (as there is a greater than 99% probability that the team will incur this risk). However, it is also very possible the team places a higher Intrinsic Value on Cox, or the team projects that salary cap to rise faster than 5%. In any event, it is probably fair to characterize the contract as “high-risk, high-reward”.
Further, the team secures some amount of optionality value. While Cox’s cap numbers represent some amount of surplus value relative to Intrinsic Value, they may also represent a further discount relative to market value in each offseason. It is entirely possible that Muhammad Wilkerson or some other player signs an even larger contract as a free agent next offseason. If that happens, the team will reap value in each offseason to the extent it is able to choose to retain Cox without the necessity to pay such market value. And because the contract is not structured in a back-loaded fashion, the team options in 2020-2022 are more valuable than in other large contracts. Phrased inversely, how likely is it that Cox will demand a new contract in 2021, at the age of 30, potentially coming off a number of Pro Bowl seasons? The degree to which this is likely is the degree to which the Eagles derive optionality value in that contract season.
While we are not in a position to draw firm conclusions on the issues of expected surplus value and quantity of optionality value, this analysis shows that the contract was within a range of reasonableness for the team, as one can point to several benefits to the team despite the player-friendly contract structure.
The Eagles ranked #1 in Commitment Index prior to executing this contract, and the team now possesses a score of 265, which signifies a true net cap commitment 265% greater than the theoretical team possessing a true net cap commitment equal to the mean of all 32 teams. Baltimore is the next closest team, with a Commitment Index score of 203. The Eagles also possess the least amount of True Cap Space for 2017, as more than $113 million worth of 2017 salary cap space is accounted for by prorated signing bonus amounts, fully guaranteed salary and minimum salary obligations. It should be noted, however, that a substantial portion of this commitment comes in the form of guaranteed salary that can be traded. As the Eagles demonstrated this offseason, the market for trading away unwanted guaranteed salary appears to be seller-friendly.
Commitment Index and True Cap Space speak solely to flexibility relative to the other teams in the league, so the conclusion should not be that the team is in a “bad” salary cap situation. Substantially all of the key players are signed for multiple seasons beyond 2016, so if the team plays well in 2016, flexibility may be a moot point. But if the team does not play to expectations, the Eagles have less ability than any other team to pivot in a different direction in 2017.
| Fletcher Cox |
| Year |
Cap Number |
Probability |
Dead Money |
Probability |
Expected Cap Number |
| 2016 |
$6,499,000 |
99.8% |
$36,299,000 |
0.2% |
$6,558,600 |
| 2017 |
$9,400,000 |
99.4% |
$29,800,000 |
0.6% |
$9,522,400 |
| 2018 |
$17,900,000 |
99.0% |
$39,650,000 |
1.0% |
$18,117,500 |
| 2019 |
$22,000,000 |
94.9% |
$29,500,000 |
5.1% |
$22,382,500 |
| 2020 |
$20,300,000 |
69.2% |
$7,600,000 |
30.8% |
$16,388,400 |
| 2021 |
$17,200,000 |
48.8% |
$1,200,000 |
51.2% |
$9,008,000 |
| 2022 |
$17,100,000 |
32.2% |
$0 |
67.8% |
$5,506,200 |
| Total: |
|
|
|
$87,483,600 |
Expected Contract Value was created by Bryce Johnston and Nick Barton.
Bryce Johnston earned his J.D. from Georgetown University Law Center in May 2014, and currently works as a corporate M&A associate in the New York City office of an AmLaw 50 law firm. Before becoming a contributor to overthecap.com, Bryce operated eaglescap.com for 10 NFL offseasons, appearing multiple times on 610 WIP Sports Radio in Philadelphia as an NFL salary cap expert. Bryce can be contacted via e-mail at bryce.l.johnston@gmail.com or via Twitter @NFLCapAnalytics.
Nick Barton is a junior at the McDonough School Business at Georgetown University. He is majoring in Finance and Operations and Information Management. Nick currently interns with an NFL team . His prior work experience includes interning with CollegeSplits and Dynamic Sports Solutions, and working as a research assistant for the Center of Applied Research of the Apostolate.