In several of my WR and TE tier articles this year, I have used consistency or lack thereof as a reason why a particular player is or is not meeting his contract expectations. However, “Player A is consistent and Player B is not” without supporting analysis isn’t a very strong argument. Today, I would like to explore two methods of determining a player’s consistency: median statistics and frequency of hitting specific milestones.
My earlier posts on receivers and tight ends looked at production when averaged over 16 games. While it is important to look at season totals, a significant missing piece was what to do with players like Marvin Jones who started the season hot, then cooled off significantly. Jones’ 2016 totals should look good when viewed as one number, but the Lions are really getting several games at amazing value and several games where they’re getting well below market value.
Method #1: Median Statistics
First, I’ll look at median statistics. For most players, median touchdowns will either be 0 or 1, so I am instead looking at how many games have at least 1 touchdown. For catches and yards, I’m looking at the true median: if a player has played in 11 games, I’m looking at how he performed in his 6th best game.
To determine an approximate median game for each of the Wide Receiver Tiers. I looked at the 2014-2016 games for each receiver currently in those tiers. The smallest sample size was Tier 2 receivers at 330 games.
Click here for a more detailed analysis of how each tier was determined. The short version is: Tier 1 includes players on contracts with APY over $14M, Tier 2 is $10M-$11.5M, Tier 3 is $6M-$8M, and Tier 4 is $3M-$5M. Tier 4 receivers are not included in this article. I included both Antonio Brown and TY Hilton in the Tier 1 group even though their contracts are not at that level yet. Brown’s inclusion should be obvious. Hilton’s contract is between Tier 1 and Tier 2. I bumped him up into Tier 1 for this exercise because his production this year is closer to Tier 1 than Tier 2.
| Tier 1 | Median Targets | Median Catches | Median Yards | Games with TD |
| Julio Jones | 11 | 7 | 106 | 38% |
| Antonio Brown | 11 | 8 | 97 | 51% |
| Demaryius Thomas | 11 | 6 | 87 | 40% |
| AJ Green | 9 | 6 | 78 | 47% |
| TY Hilton | 9 | 5 | 77 | 33% |
| Alshon Jeffery | 8 | 5 | 72 | 40% |
| Dez Bryant | 8 | 4 | 72 | 55% |
| Average | 10 | 6 | 84 | 43% |
Another way to read this data is: “In 50% of AJ Green’s games, he will catch 6 or more passes” or “In 50% of Green’s games, he will accumulate less than 78 yards”.
Quick Observations on Tier 1:
| Tier 2 | Median Targets | Median Catches | Median Yards | Games with TD |
| Jordy Nelson | 9 | 6 | 83 | 67% |
| Emmanuel Sanders | 9 | 6 | 75 | 31% |
| Larry Fitzgerald | 9 | 6 | 62 | 27% |
| Keenan Allen | 9 | 6 | 58 | 26% |
| Randall Cobb | 7 | 5 | 58 | 38% |
| Jeremy Maclin | 8 | 4 | 57 | 44% |
| Doug Baldwin | 6 | 4 | 51 | 33% |
| Allen Hurns | 7 | 4 | 46 | 38% |
| Vincent Jackson | 7 | 3 | 44 | 16% |
| Average | 8 | 5 | 59 | 35% |
Quick Observations on Tier 2:
| Tier 3 | Median Targets | Median Catches | Median Yards | Games with TD |
| Brandon Marshall | 10 | 6 | 68 | 50% |
| Eric Decker | 8 | 5 | 62 | 58% |
| Golden Tate | 8 | 6 | 57 | 23% |
| Marvin Jones | 6 | 4 | 54 | 26% |
| Pierre Garcon | 7 | 4 | 51 | 26% |
| DeSean Jackson | 6 | 4 | 51 | 37% |
| Michael Crabtree | 8 | 5 | 49 | 37% |
| Mike Wallace | 6 | 4 | 46 | 33% |
| Torrey Smith | 5 | 2 | 38 | 37% |
| Travis Benjamin | 5 | 3 | 37 | 19% |
| Mohamed Sanu | 4 | 3 | 28 | 19% |
| Average | 7 | 4 | 49 | 33% |
Quick Observations on Tier 3:
As expected, Tier 1 receivers have median games that are better that Tier 2 receivers who have better median games than Tier 3 receivers. One way I attempted to quantify this into a grade was to consider the difference between a player’s game averages and a player’s median game. Players with a lower score (less difference) are more consistent.
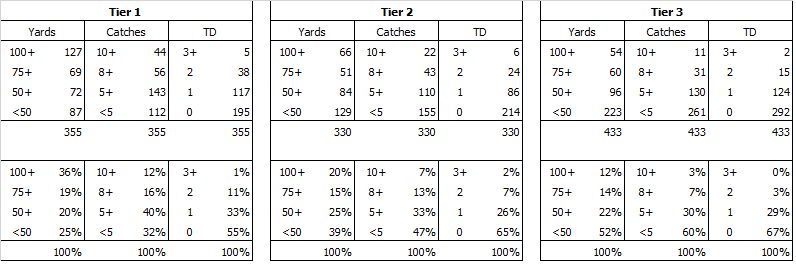
Method #2: Milestones
A second way to look at consistency is the frequency with which players hit specific milestones. For catches, I used milestones of <5, 5-7, 8-9, and 10+ catches, for yards, I used <50, 50-74, 75-99, and 100+, and for touchdowns, I used 0, 1, 2, and 3+.
My expectation was that a Tier 1 receiver will total 100 yards in a game more often than 75, 75 more often than 50, etc. A Tier 2 receiver should total 100 yards less often than a Tier 1 receiver but more often than a Tier 3 receiver. The same principles apply to catches and touchdowns.
The total counts for each tier are shown below along with the graphical representation of the percentage of games when those milestones are achieved.
The results for catches and yards are pretty much in line with what should be expected: Tier 1 receivers have games with more catches and yards with better consistency than Tier 2 or Tier 3 receivers. A Tier 1 receiver will have 50 or more yards in 75% of games while Tier 2 and 3 receivers will only pass 50 yards in 61% and 48% of their games. Tier 1 receivers have 5 or more receptions in 68% of games while Tier 2 and 3 receivers have 5 or more receptions in 53% and 40% of their games.
Summary and Final Quick Thoughts
This analysis is meant to be used in conjunction with season-long averages. If two players have near-identical annual production, but one is more consistent, that player should be compensated higher within the same Tier.
I am aware that in some games Tier 1 receivers are used as decoys. This is most often cited when discussing Julio Jones. I haven’t done enough research to determine if one player receives significant different treatment than others of the same tier, so I haven’t considered that in today’s post.
Please leave a note in the comments section below if you believe I missed something related to either of these two methods or if I missed a method entirely.
With the final outcomes in for this years option eligible rookies I thought it would…
We had a little discussion over the last few days about discounting of future draft…
With the 2024 NFL Draft in the books we now have a final estimate for…
With the second round of the 2024 draft in the books I wanted to go…
With the first round of the 2024 draft in the books I wanted to go…
For those who are premium subscribers I put together a pdf file breaking down the…