When amateur capologists write articles proposing contract structures for extension candidates or free agents, they typically use some sort of methodology for determining primary deal points such as total contract value, average annual value, guaranteed money, and three-year cash flow. However, I have noticed, both when engaging in this exercise myself and when reading the work of others, that there does not seem to be an existing methodology for determining how the cap numbers of a hypothetical contract should be allocated once the primary deal points for the hypothetical contract have been determined. As a result, I took a look at a number of active contracts to see how cap numbers have actually been allocated.
I collected a sample of 144 active contracts, each of which 4 years, 5 years, or 6 years in length. In addition to separating the contracts based on length, I also separated them based on contract structure. The three contract structure categories I used were (i) “Traditional,” (ii) “Pay-As-You-Go,” (iii) and “Hybrid.” I define a Traditional contract as one in which more than 2/3 of the fully guaranteed money comes in the form of a signing bonus. I define a Pay-As-You-Go contract as one in which less than 1/3 of the fully guaranteed money comes in the form of a signing bonus. I define a Hybrid contract as one in which between 1/3 and 2/3 of the fully guaranteed money comes in the form of a signing bonus. I realize that this is not a particularly scientific way of segregating the contracts, but I think these parameters generally capture the attributes that we think about when describing different types of contract structures.
As a result, I had 9 groupings of contracts: 4 Year Traditional (22 contracts), 5 Year Traditional (28 contracts), 6 Year Traditional (9 contracts), 4 Year Hybrid (16 contracts), 5 Year Hybrid (28 contracts), 6 Year Hybrid (10 contracts), 4 Year Pay-As-You-Go (17 contracts), 5 Year Pay-As-You-Go (14 contracts), and 6 Year Pay-As-You-Go (1 contract). I disregarded the 6 Year Pay-As-You-Go due to lack of sample size.
For each contract group, I added up the cap numbers of all of the contracts in the group for each contract season, and then divided each of those sums by the overall combined value of all of the contracts in the group. For example, in the 4 Year Traditional grouping, the sum of the cap numbers for the first year of the 22 contracts was $70,902,500, and the overall combined value of all 22 contracts was $500,700,000. As a result, we can expect the first year cap number of a 4 Year Traditional contract to account for 14% of the total value of the contract.
In order to use this information to design a hypothetical contract, the first step would be to determine appropriate numbers – using whatever methodology deemed appropriate – with respect to major deal points such as total value, guaranteed money, cash flow, etc. The second step would be to identify the historically preferred contract structure for the team in question. For example, a hypothetical contract for the Buccaneers should utilize the Pay-As-You-Go models, but a hypothetical contract for the Steelers should utilize the Traditional models. The last step would be to design the hypothetical contract using the major deal point numbers and the remainder of the contract numbers so as to cause the cap number distribution of the hypothetical contract to mirror the applicable model as closely as possible.
For the sake of clarification, there is no “should do” element to this post. I am not saying that these cap number allocations are efficient, or that one type of contract structure is better than another (I actually think that none of them are optimal). I am simply showing what teams have done on average in recent years in order to provide a guide to allocating numbers in a realistic way for hypothetical contracts. I will continuously update my sample size as new contracts are signed.
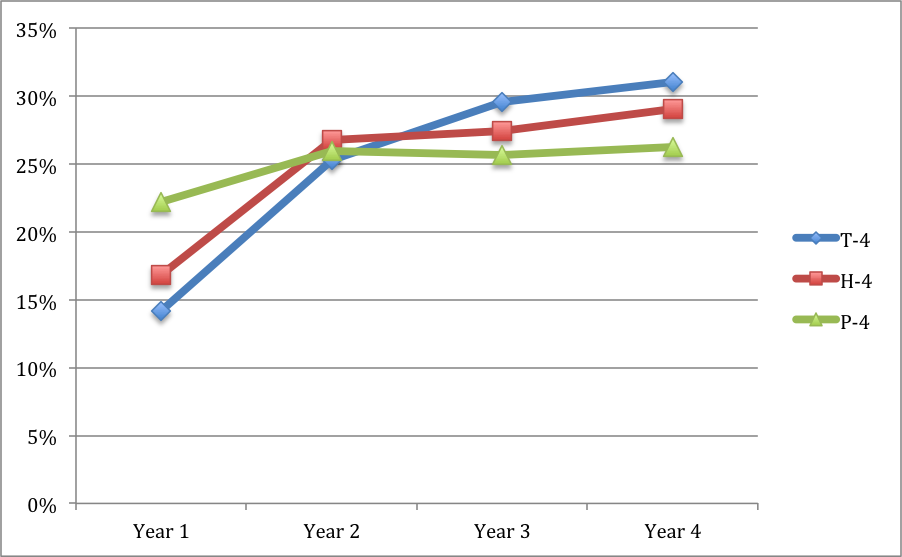
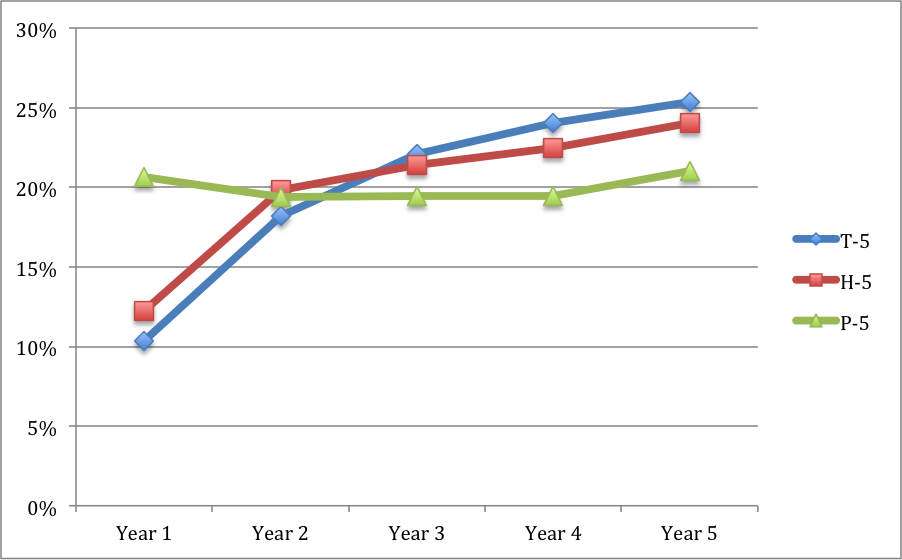
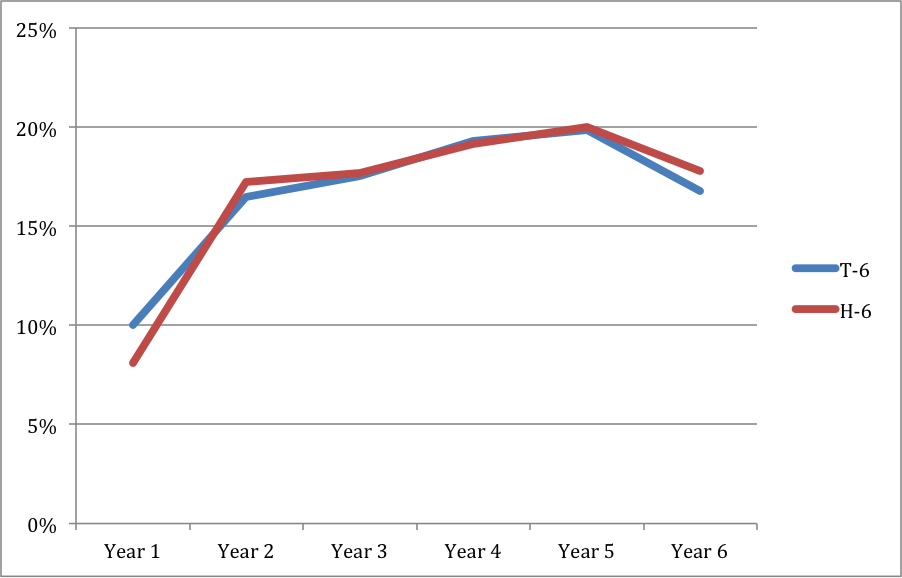
The first table below displays the percentage allocations of cap numbers for each contract season, and the second table displays the aggregate cap values for each contract season (adjusted so that the combined total values for each contract grouping equal $1 billion, for purposes of comparison). The charts at the bottom display the numbers in the tables in curve format to show how cap numbers tend to increase or decrease over time depending on contract structure.
As would be expected, the distribution of cap numbers for Pay-As-You-Go contracts is generally flat, with the first year cap number of the 5 Year grouping even starting out higher than subsequent years. Traditional contracts see their cap numbers increase at a faster pace than Hybrid contracts, which is not surprising considering that Hybrid contracts generally require higher base salaries in earlier years than Traditional contracts due to having smaller signing bonuses than Traditional contracts. Also note that in both 6 Year groupings, the cap number in the 6th year is on average lower than the cap number in the 5th year. This is because signing bonus proration finishes after 5 years, but base salaries in the 6th year of a contract tend to be similar to base salaries in the 5th year of a contract.
| T-4 | H-4 | P-4 | |
| Year 1 | 14% | 17% | 22% |
| Year 2 | 25% | 27% | 26% |
| Year 3 | 30% | 27% | 26% |
| Year 4 | 31% | 29% | 26% |
| Total | 100% | 100% | 100% |
| T-5 | H-5 | P-5 | |
| Year 1 | 10% | 12% | 21% |
| Year 2 | 18% | 20% | 19% |
| Year 3 | 22% | 21% | 19% |
| Year 4 | 24% | 22% | 19% |
| Year 5 | 25% | 24% | 21% |
| Total | 100% | 100% | 100% |
| T-6 | H-6 | P-6 | |
| Year 1 | 10% | 8% | — |
| Year 2 | 16% | 17% | — |
| Year 3 | 18% | 18% | — |
| Year 4 | 19% | 19% | — |
| Year 5 | 20% | 20% | — |
| Total | 100% | 100% | — |
| T-4 | H-4 | P-4 | |
| Year 1 | 141,606,751 | 168,139,658 | 221,962,439 |
| Year 2 | 252,671,260 | 267,304,889 | 259,173,790 |
| Year 3 | 295,336,529 | 274,460,050 | 256,456,192 |
| Year 4 | 310,385,460 | 290,095,402 | 262,407,579 |
| Total | $1,000,000,000 | $1,000,000,000 | $1,000,000,000 |
| T-5 | H-5 | P-5 | |
| Year 1 | 103,149,325 | 122,142,263 | 206,719,411 |
| Year 2 | 181,820,575 | 198,246,095 | 193,670,537 |
| Year 3 | 220,776,041 | 214,193,457 | 194,456,275 |
| Year 4 | 240,392,580 | 224,912,092 | 194,810,704 |
| Year 5 | 253,861,479 | 240,506,093 | 210,343,073 |
| Total | $1,000,000,000 | $1,000,000,000 | $1,000,000,000 |
| T-6 | H-6 | P-6 | |
| Year 1 | 100,162,406 | 81,002,567 | — |
| Year 2 | 164,870,549 | 172,575,908 | — |
| Year 3 | 175,538,643 | 176,822,996 | — |
| Year 4 | 193,076,344 | 191,712,656 | — |
| Year 5 | 198,572,029 | 200,118,466 | — |
| Total | $1,000,000,000 | $1,000,000,000 | — |
With the 2024 NFL Draft in the books we now have a final estimate for…
With the second round of the 2024 draft in the books I wanted to go…
With the first round of the 2024 draft in the books I wanted to go…
For those who are premium subscribers I put together a pdf file breaking down the…
With only a few days before the 2024 NFL Draft, it's that time again to…
Every year as the draft approaches I like to look at different trends over the…