[adsenseyu1]
Rather than just give you something long to read, I’ll discuss the figures in the video linked here that’s made up of some of the notes I took when looking at the data. I hope that it’s a nice supplement to the figures below and it is meant to be just that, a supplement, as I think that everyone should look at the figures below and come to their own conclusions. (To open the link in another tab, hold the command button and left-click on your keypad/mouse.)
As always, if you like what I do here at Over The Cap and you want me to do it more often, please feel free to donate! If you think I’m an idiot, to paraphrase the great philosopher Chingy, I’m always one tweet away: @ZackMooreNFL.
During what was supposed to be an epic snow week across the Northeast during Super Bowl week, I wanted to give you guys some interesting tables that we could analyze while we’re stuck inside. Over the last couple weeks, you haven’t heard much from me because I’ve been analyzing the salary cap situation of the final four teams, the 2007 Patriots (the only perfect regular season team of the cap era) and the regular season statistics of the 20 Super Bowl champions of the salary cap era.
Jason’s article titled, “Super Bowl Titles and High Salary QBs,” got me thinking about how the NFL compensates quarterbacks and something Ray Lewis spoke about early in the season after Monday Night Football. I don’t remember his exact quote, but he talked about the increasing salaries for QBs and how it doesn’t allow other players to get paid the kind of money they might deserve.
When you look at some of the QBs getting paid big money AND looking at the statistics of the last 20 Super Bowl champs, you see that team don’t even need a 4000 yard passer to win, you realize he might be onto something.
Jason’s article also made me realize that many of the thoughts we share on here, while they should give people some clarity on issues and answer questions, they should also raise a lot of good questions as well, a lot of things we can dig deeper into.
An example of some of the questions that Jason’s article raised for me, and that I’m going to try to explain a bit here, are these:
- How can a team get Super Bowl caliber production for the least amount of money?
- How can teams best replicate the offensive and defensive statistics shown on these tables from a salary cap standpoint?
And the first question that these tables and my analysis of them should raise is: Where should teams spend their money to get the kind of production needed to succeed? Considering that this will be mostly about the statistics, that’s the next question we’ll want to answer after looking at this and a question that’s individualized for each organization.
When you look at Figure 1, you’ll see the true value of Russell Wilson. Not only does he produce statistics near the average for pass yards for Super Bowl champs, but his 849 yards rushing have helped the Seahawks explode past the average rush totals for champs. If they win on Sunday, they’ll be the best rushing Super Bowl champs of the salary cap era beating the 1998 Denver Broncos by 294 yards.
Wilson’s value isn’t just in the fact that he’d be the second lowest QB cap charge for a Super Bowl champion at 0.49%, just 0.02% more than Tom Brady’s in 2001, but his 4324 total yards make him the fifth most productive QB of the salary cap era. The only Super Bowl winning QBs with more total yards in their championship regular season were Eli Manning (4948), Kurt Warner (4445), Peyton Manning (4433), and Drew Brees (4421). That’s pretty good company to be in and why he’s in for a massive payday this offseason.
Wilson is also the perfect example of how great organizations go out and get players who fit what they’re trying to do. While they overpaid for Matt Flynn, they took Wilson in the third round and got more than they could have asked for when he beat Flynn out in camp. This is also partly due to the competitive nature of the Pete Carroll’s system where the best players play no matter what, which has led to them to have a team filled with starters who were drafted in the low-rounds or not drafted at all. Great organizations don’t care where you were drafted, they understand value and see the value of drafting a Richard Sherman in the fifth round or getting Jermaine Kearse as an undrafted free agent because they know these guys have the skill sets to accomplish exactly what they’re going to ask them to do.
According to Pro Football Focus, Doug Baldwin is the 17th best blocking wide receiver in the NFL. Other than just the money factor, this might be part of why they were fine with letting Golden Tate go and having Baldwin replace him as Tate was the 109th best blocking WR this year. In terms of offensive penalties, Baldwin is tied for first as one of the least penalized receivers in the NFL according to PFF. He’s also ninth in the NFL with a 73.3% catch rate
I feel that this shows that while he might be overlooked in traditional statistical measurements, his value can be seen through stats that actually matter more to what the Seahawks are trying to accomplish as an offense anyway. They don’t need a guy to catch 100 balls for 1500 yards, so they don’t go out and pay for them, they instead find what they need and capitalize.
Tom Brady had another great season and, while his cap number this season would make him the fifth QB with a cap charge over 10% of his team’s cap, 11.1%, his production has been worth it. His restructured contract will also help the Patriots stay competitive for the rest of his career. His new deal is considered cheap because he has a team friendly deal at only 10% of next year’s cap. Brady’s reasonable cap charge allows them to try to keep key players like Shane Vereen and Darrelle Revis because he understands the importance of leaving space for him to have a Super Bowl caliber team around him in the ultimate team sport.
One example of how the Patriots excel at getting as much value as they can out of players is their backfield. With Vereen, Jonas Gray, LeGarrette Blount, Stevan Ridley and Brandon Bolden, they had a cap charge of only 3.4% of their cap, Vereen was their most productive back with only 838 total yards (only 391 rushing), with Gray second at 419, but they jumbled together 1727 rush yards which put them close to the 1959 figure that the average Super Bowl champion has.
Bill Belichick and Josh McDaniels are also masters of attacking an opposing team’s weaknesses. Over the last calender year, the Pats have played the Colts three times, LeGarrette Blount has had a 166-yard and a 148-yard rushing game and Jonas Gray has had a 201-yard game. So much of the value teams get out of their salary cap is through great coaching.
These are just some of the things I look into in the video blog you’ll see above, I hope you enjoy and I hope you share with me some of your thoughts on the figures below.
As always, you can click on the figures to enlarge them.
Figure 1: Offensive Rankings
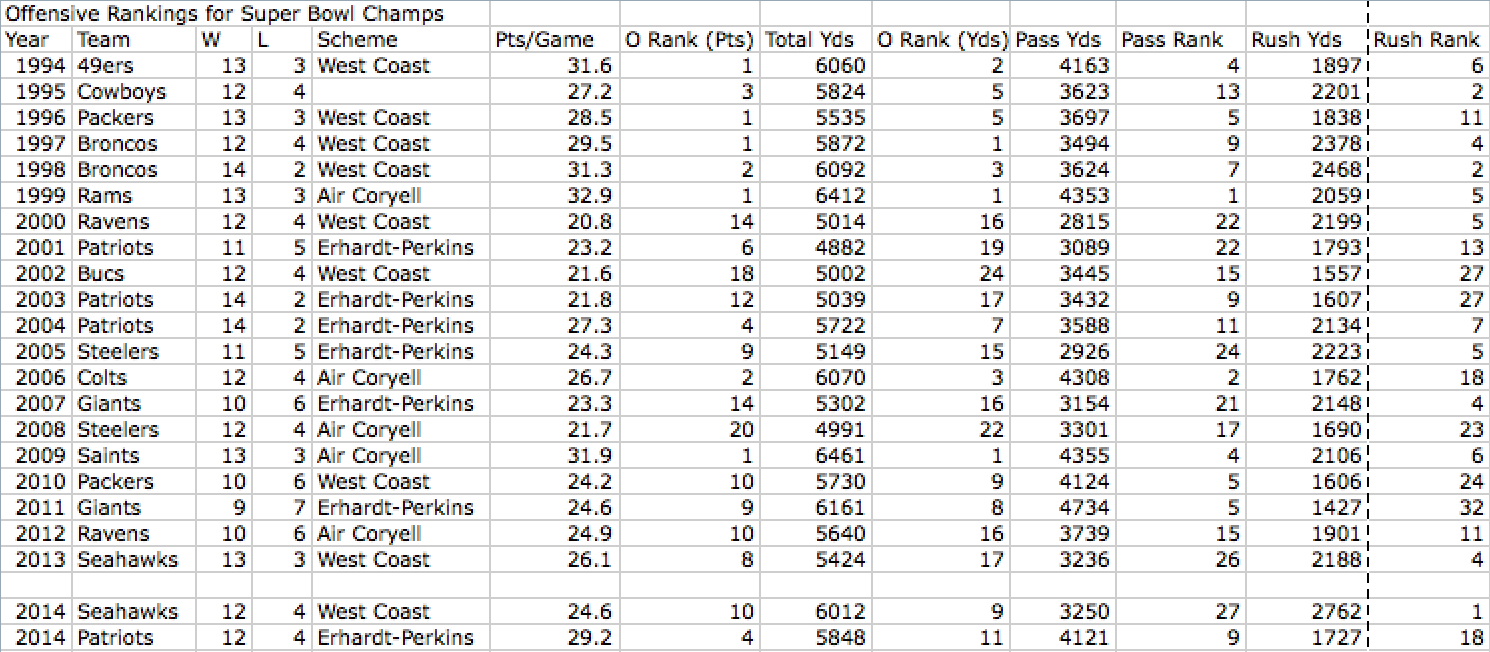
Figure 2: Defensive Rankings

Figure 3: Super Bowl QBs
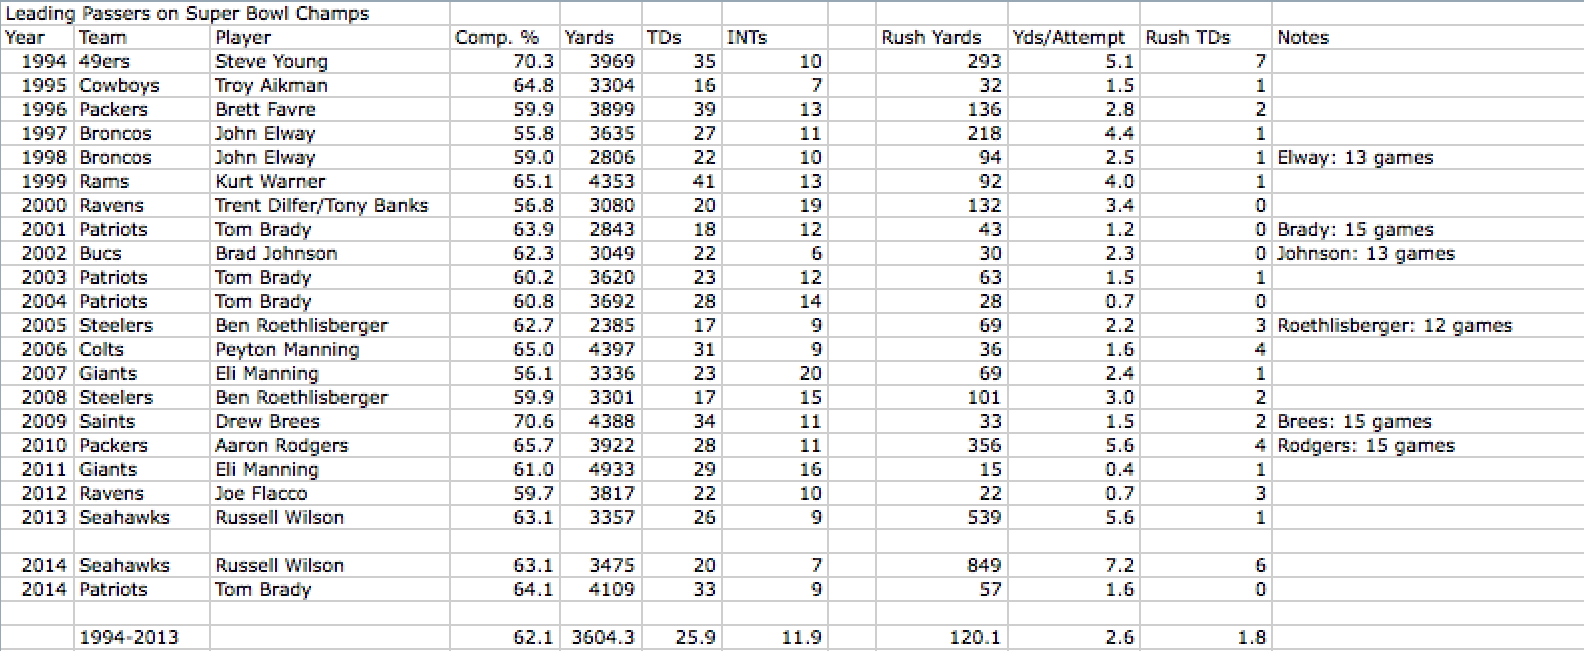
Figure 4: Super Bowl RBs
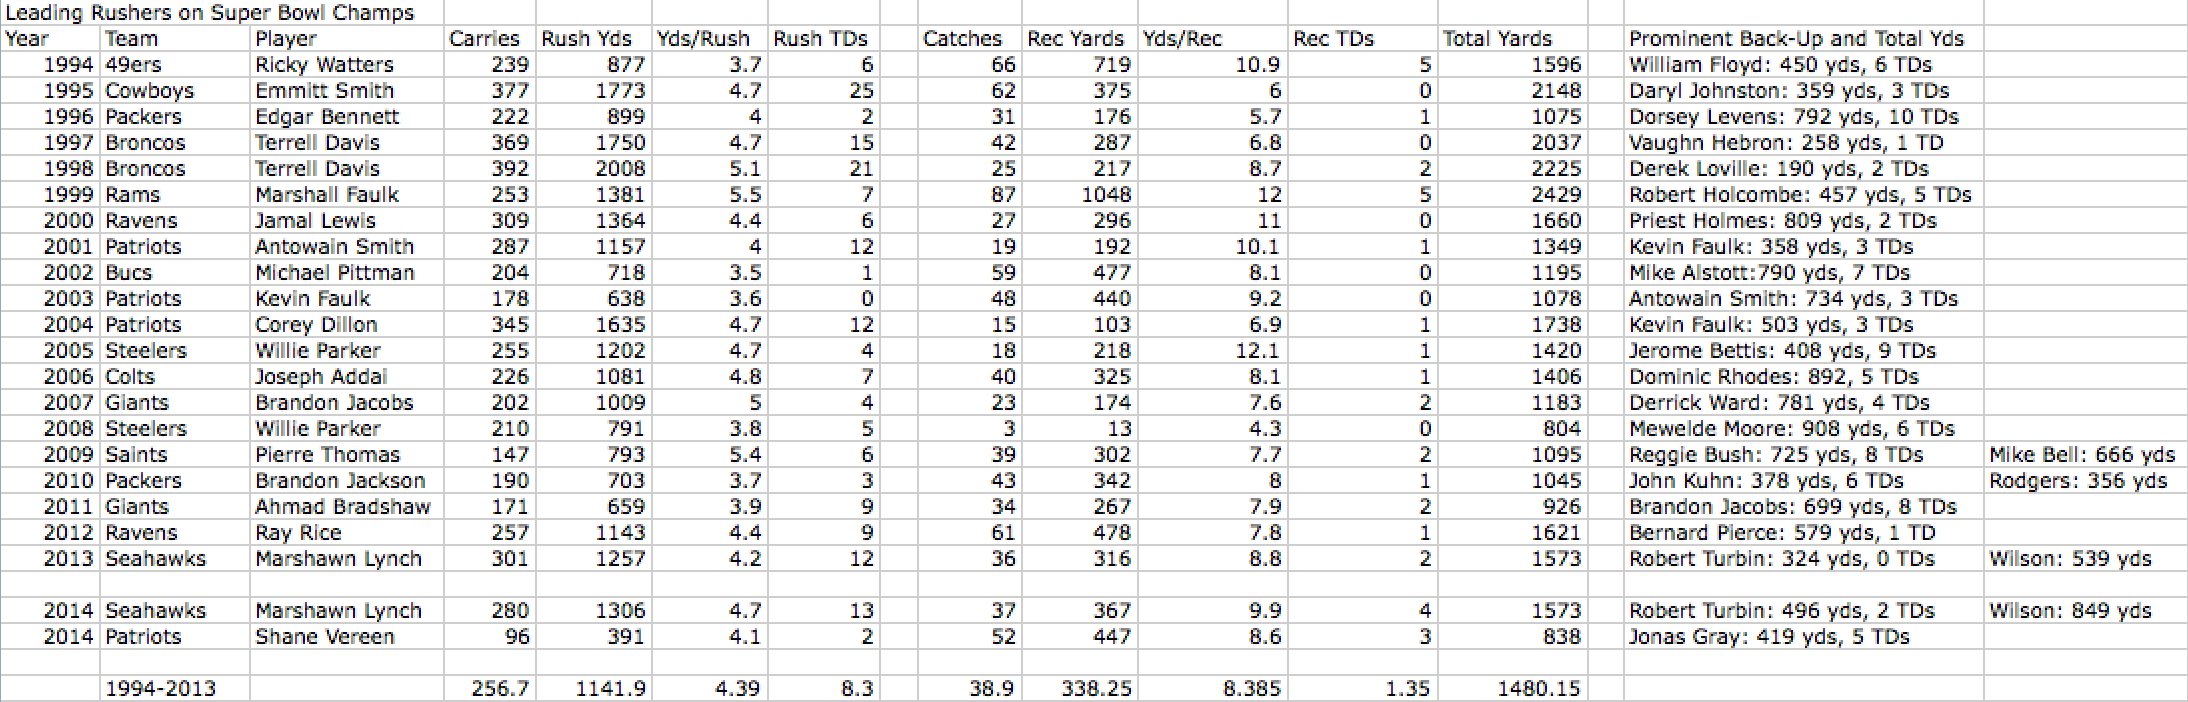
Figure 5: Super Bowl WRs
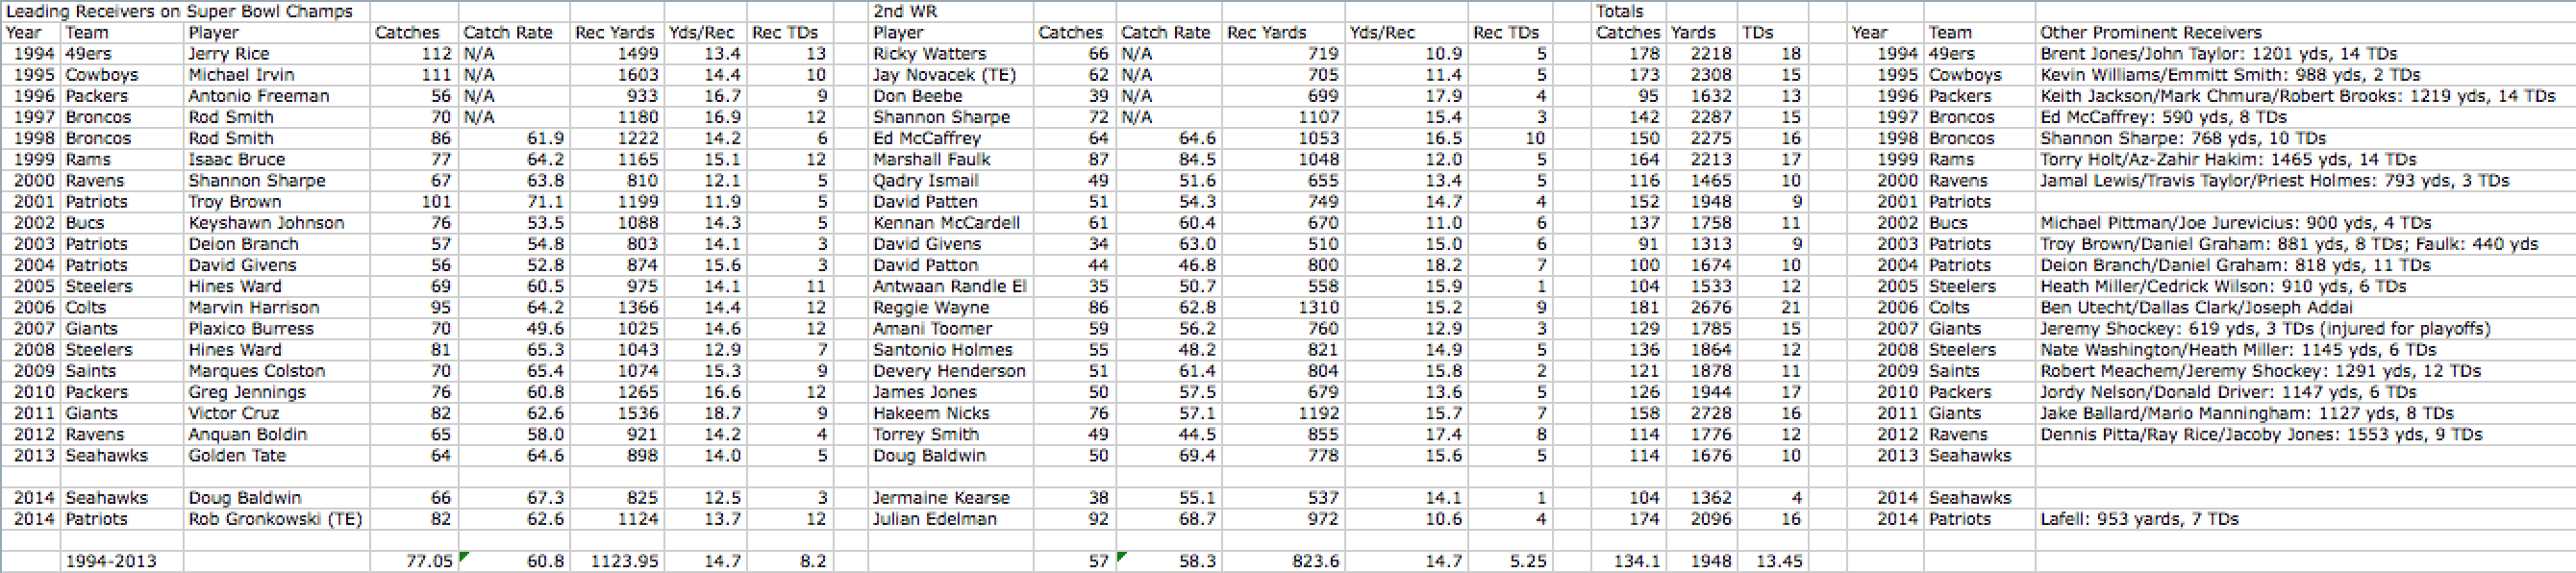
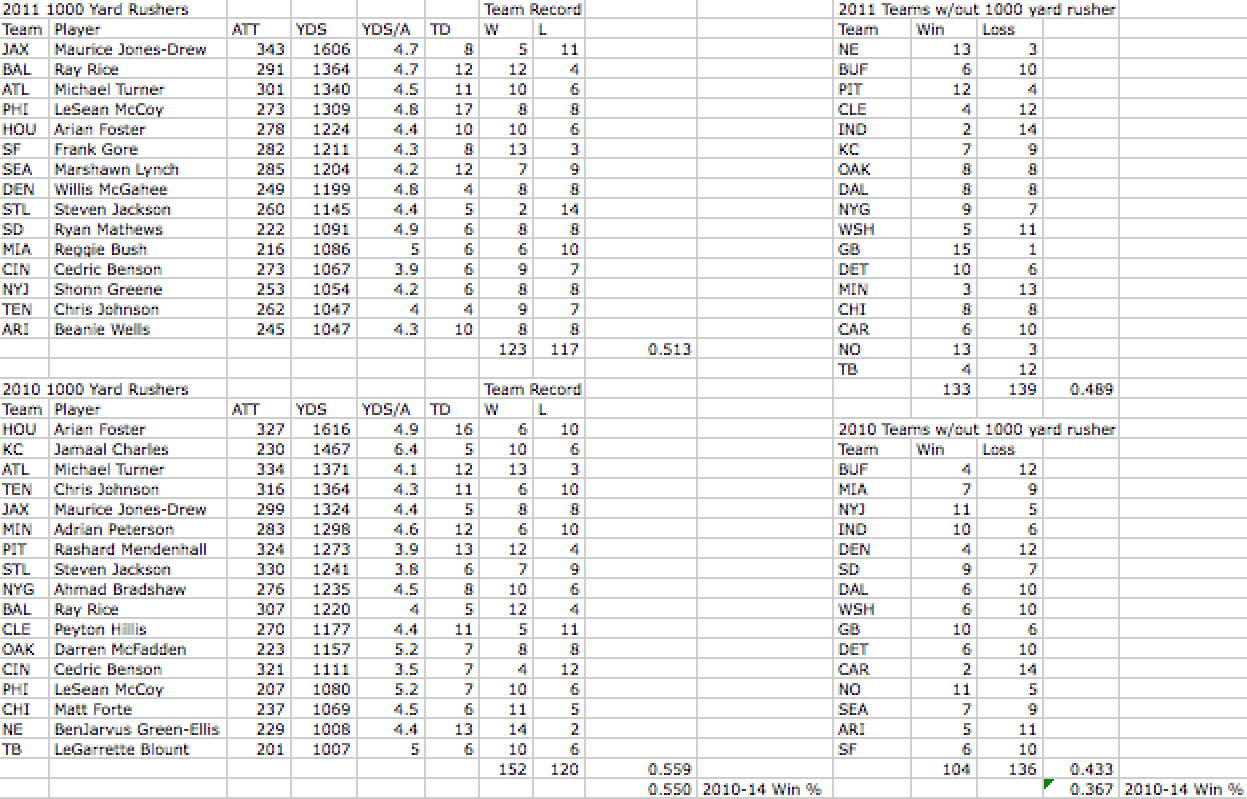
Figure 6: 1000 Yard RBs and Win Correlation 2012-14

Figure 7: 1000 Yard RBs and Win Correlation 2010-11