Every now and then around draft time I try to do some type of look at the NFL draft and value of the players selected through some financial means and I decided to go back and do that again this year. This time around I wanted to look back at the first five years of the current CBA, which introduced the rookie wage scale, and look at some summary data that may help us place a better value on a draft pick.
The first thing that I thought was interesting to look at was just the general outcome of the rookie contract. We see teams these days going out of their way to accumulate picks through the compensatory draft system, adding later round picks via trades, and so on. I broke the data down by round but broke the first round up into three subcategories. The first is the top 10 picks who are generally regarded as the best in the draft and have a high number fifth year option. The second are picks 11 to 20 who generally have had their entire contract guaranteed. The final one is 21 to 32 who have most of their contract but not all of it guaranteed. For the 2015 draft class if the player is currently on their option year I excluded them from the analysis.
| Round | Expired | Option cut | Extended | Terminated | Traded |
| Top 10 | 24.4% | 4.4% | 37.8% | 8.9% | 24.4% |
| 11 to 20 | 45.5% | 4.5% | 31.8% | 6.8% | 11.4% |
| 21 to 32 | 42.9% | 1.8% | 21.4% | 16.1% | 17.9% |
| 2 | 47.1% | 0.0% | 15.9% | 26.1% | 10.8% |
| 3 | 38.0% | 0.0% | 13.5% | 39.2% | 9.4% |
| 4 | 38.8% | 0.0% | 5.3% | 49.5% | 6.4% |
| 5 | 21.2% | 0.0% | 6.7% | 66.5% | 5.6% |
| 6 | 14.5% | 0.0% | 5.2% | 75.6% | 4.7% |
| 7 | 11.6% | 0.0% | 2.2% | 84.0% | 2.2% |
The thing that jumped out at me is the relative low worth of the 6th and 7th round pick. Over 75% of the contracts were terminated by the team that drafted them and less than 21% were either extended or finished the contract with the team. Now that doesn’t mean that the player was cut and never came back (players bounce back all the time between the practice squad and active roster) but it does mean that the team was not worried about exposing the player to waivers at some point during their tenure.
The second thing that jumped out to me was the extension figures (extension meaning a player re-signed before the final year of his rookie contract was completed in week 17) for rounds 2 and 3. People often ask about why there is such a push for those 3rd round comp picks and I would think this is why. While there is value in the fourth round (39% of picks playing out their contract), the extension rates are dramatically different. Basically if you are looking for more long term probability of finding help it is going to come in the 3rd or higher rounds.
The last thing is we so often hear the phrase about 1st rounders being a “10 year solution” that pretty much a joke. 38% of top 10 players are cut or traded before their rookie deal ends. Another 25% play out their contract. Here is the breakdown by round of where a player is playing after the first four (or five years for a 1st rounder who played out his deal) of his contract.
| Round | New Team | Drafting Team | Out of NFL |
| Top 10 | 44.4% | 44.4% | 11.1% |
| 11 to 20 | 59.1% | 36.4% | 4.5% |
| 21 to 30 | 41.1% | 35.7% | 23.2% |
| 2 | 59.2% | 27.4% | 13.4% |
| 3 | 48.5% | 21.6% | 29.8% |
| 4 | 46.8% | 16.0% | 37.2% |
| 5 | 39.1% | 14.0% | 46.9% |
| 6 | 34.2% | 13.5% | 52.3% |
| 7 | 29.3% | 4.0% | 66.7% |
The NFL is really all about short term fixes and the draft is no different. Teams draft and churn those draft picks over a four year period. These numbers also show some of the value that exists by dropping out of the backend of the first round and into the second round and I think also identify why some of those third round comps are looked at as far more valuable than the others. 7th round picks I think also continue to be something generally useless to go out of your way to acquire.
Still while retention rates are important they still aren’t really giving us the value of the pick. How do we get closer to that value? Well let’s look at the average annual contract value that the player receives at the five (or six year for first rounders) mark. That average contract value is generally dependent on the performance of the player during those first few years in the NFL and really tells us more about the player than any stat we can try to use.
| Round | AAV (Same Team) | AAV (New Team) | Overall AAV |
| Top 10 | $15,353,755 | $7,451,139 | $10,135,508 |
| 11 to 20 | $12,989,670 | $5,946,435 | $8,237,319 |
| 21 to 32 | $9,462,188 | $5,757,780 | $5,744,155 |
| 2 | $9,769,549 | $4,720,995 | $5,472,249 |
| 3 | $8,224,624 | $3,525,858 | $3,490,978 |
| 4 | $4,598,489 | $3,062,778 | $2,167,442 |
| 5 | $5,152,689 | $2,686,150 | $1,770,099 |
| 6 | $3,283,765 | $1,678,245 | $1,016,280 |
| 7 | $3,266,944 | $2,066,059 | $736,722 |
Some important takeaways here. The numbers clearly reiterate why moving from the backend of the 1st to the 2nd round makes sense. The overall salary expectation for the player (that includes those out of the NFL) is virtually the same. The high end number for those remaining on the original team is also virtually the same. So in that sense giving up a late 1 for a 2nd rounder and a 3rd rounder is a no brainer.
You can also see that big value in the third round pick. The drop off in high end talent is not that large between the late 1st and 3rd (about a 13% drop) though there is more risk in the 3rd round pick since the flame out level is much higher which drives the expected value down from $5.7 to $3.5 million. Still this is why that 3rd round comp pick is so valuable compared to the 4th and especially the later ones.
The 6th and 7th round picks are basically no better than just signing a minimum salaried veteran but at half the cost during the rookie years and some upside potential. This is why teams likely prefer these players over a veteran.
Lets now break these salaries down by rounds into various salary bins.
| Round | Over $15M | $10 to $15M | $7.5 to $10M | 5 to $7.5M | 2.5 to 5M | 1.5 to 2.5M | 745K to $1.5M | Under Vet Minimum | Out of NFL |
| Top 10 | 26.7% | 26.7% | 6.7% | 13.3% | 8.9% | 6.7% | 0.0% | 0.0% | 11.1% |
| 11 to 20 | 18.2% | 25.0% | 11.4% | 6.8% | 13.6% | 9.1% | 11.4% | 0.0% | 4.5% |
| 21 to 32 | 7.1% | 23.2% | 3.6% | 12.5% | 19.6% | 3.6% | 7.1% | 0.0% | 23.2% |
| 2 | 16.6% | 24.8% | 6.9% | 11.0% | 14.5% | 6.2% | 6.2% | 0.0% | 13.8% |
| 3 | 5.7% | 15.9% | 8.9% | 15.9% | 12.7% | 4.5% | 15.9% | 7.0% | 13.4% |
| 4 | 2.3% | 8.2% | 9.4% | 9.9% | 10.5% | 7.6% | 15.2% | 7.0% | 29.8% |
| 5 | 1.6% | 1.6% | 3.7% | 9.0% | 12.8% | 9.6% | 20.2% | 4.3% | 37.2% |
| 6 | 1.1% | 2.2% | 4.5% | 6.7% | 6.1% | 5.0% | 19.6% | 7.8% | 46.9% |
| 7 | 0.0% | 0.5% | 1.6% | 4.7% | 7.3% | 5.2% | 14.0% | 14.5% | 52.3% |
These numbers again should reinforce the value of that 2nd round pick and even 3rd round pick compared to the late first round selection. The odds of higher level success are basically the same.
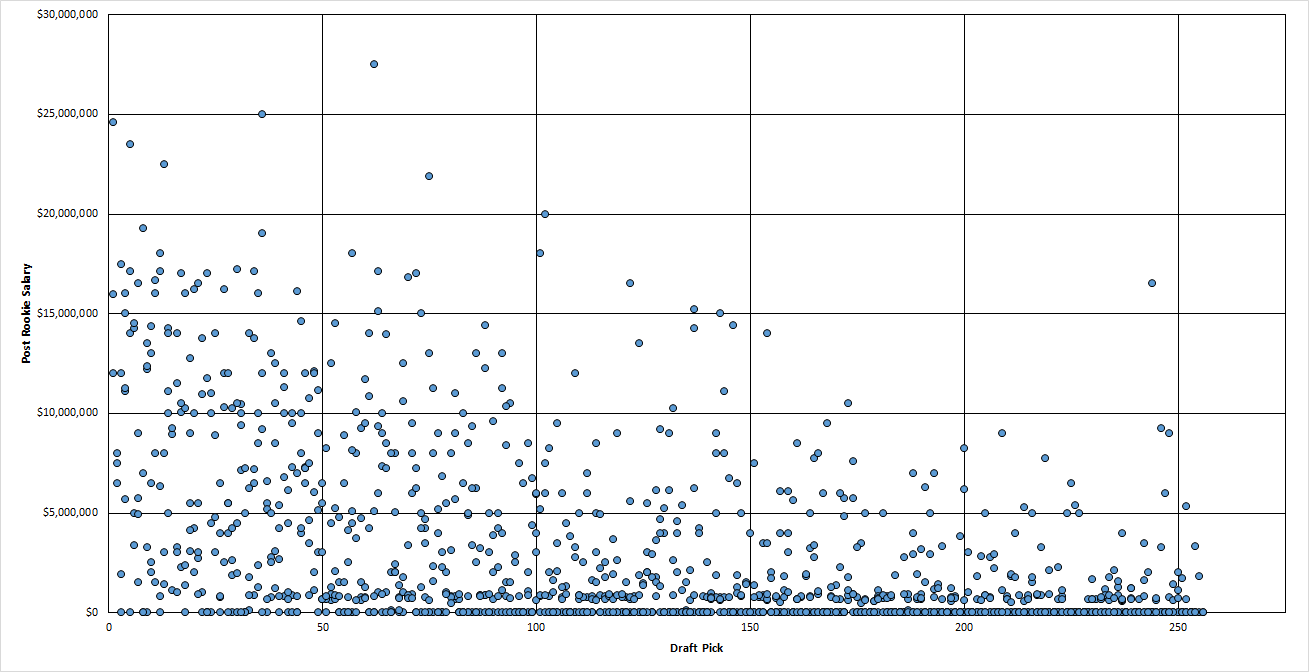
So how do we look pick by pick? This is the ultimate salary outcome of every selection made between 2011 and 2015 that is no longer on that initial rookie contract.
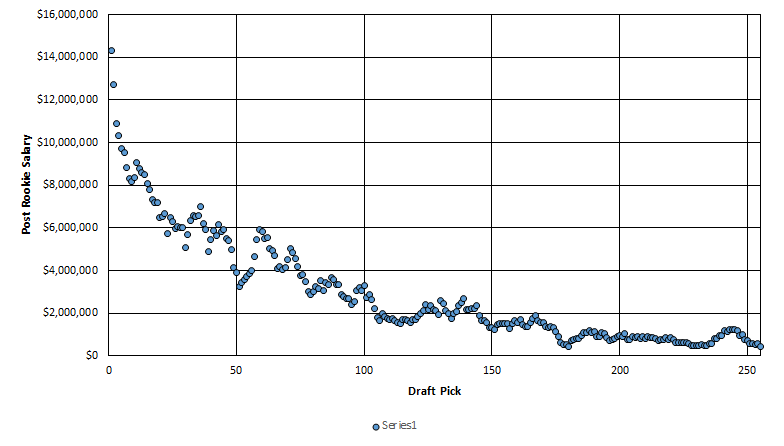
So what if we begin to average out the values for the type of player available at every selection? Basically to do this we want to include a few picks before and after (with the size growing a bit as the draft gets longer) to take into account the type of player that would likely be available for each pick. This was just completely subjective on my part as to how I split them. This should also show you how undervalued draft picks are with the top pick being worth around a $14M player on a $8.8M contract.
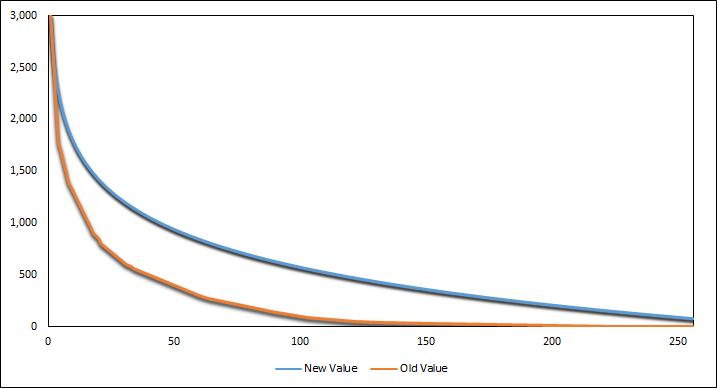
If you smooth the data out you can then come up with something of a point system for each pick which would look something like this.
You can see the value that teams can drive out of the draft when exploiting the current chart when they move up. Now I think we can further improve on this by also taking into account positions. Right now I based these numbers off salaries but its also not entirely fair to compare a mid grade QB to an elite LB since the positional salary inflates the worth of the mid level QB compared to other positions. I have an idea on how to do this and if I get the time in the next few days Ill make those adjustments and see how it comes out but for a basic new way to look at how we should value picks in the draft I think this is a pretty good way to start a different discussion on valuation of the picks and potential that exists round by round. For those curious about the value of each player this table has the value and corresponding points for each selection.
| Pick | Value | Points |
| 1 | $14,653,786 | 3000 |
| 2 | $12,870,846 | 2635 |
| 3 | $11,827,893 | 2421 |
| 4 | $11,087,906 | 2270 |
| 5 | $10,513,928 | 2152 |
| 6 | $10,044,953 | 2056 |
| 7 | $9,648,441 | 1975 |
| 8 | $9,304,966 | 1905 |
| 9 | $9,002,000 | 1843 |
| 10 | $8,730,987 | 1787 |
| 11 | $8,485,827 | 1737 |
| 12 | $8,262,013 | 1691 |
| 13 | $8,056,124 | 1649 |
| 14 | $7,865,500 | 1610 |
| 15 | $7,688,034 | 1574 |
| 16 | $7,522,026 | 1540 |
| 17 | $7,366,085 | 1508 |
| 18 | $7,219,060 | 1478 |
| 19 | $7,079,986 | 1449 |
| 20 | $6,948,047 | 1422 |
| 21 | $6,822,547 | 1397 |
| 22 | $6,702,887 | 1372 |
| 23 | $6,588,546 | 1349 |
| 24 | $6,479,073 | 1326 |
| 25 | $6,374,069 | 1305 |
| 26 | $6,273,184 | 1284 |
| 27 | $6,176,107 | 1264 |
| 28 | $6,082,560 | 1245 |
| 29 | $5,992,297 | 1227 |
| 30 | $5,905,094 | 1209 |
| 31 | $5,820,751 | 1192 |
| 32 | $5,739,086 | 1175 |
| 33 | $5,659,934 | 1159 |
| 34 | $5,583,145 | 1143 |
| 35 | $5,508,582 | 1128 |
| 36 | $5,436,120 | 1113 |
| 37 | $5,365,643 | 1098 |
| 38 | $5,297,046 | 1084 |
| 39 | $5,230,231 | 1071 |
| 40 | $5,165,107 | 1057 |
| 41 | $5,101,592 | 1044 |
| 42 | $5,039,607 | 1032 |
| 43 | $4,979,081 | 1019 |
| 44 | $4,919,947 | 1007 |
| 45 | $4,862,141 | 995 |
| 46 | $4,805,606 | 984 |
| 47 | $4,750,287 | 973 |
| 48 | $4,696,133 | 961 |
| 49 | $4,643,095 | 951 |
| 50 | $4,591,129 | 940 |
| 51 | $4,540,192 | 929 |
| 52 | $4,490,244 | 919 |
| 53 | $4,441,247 | 909 |
| 54 | $4,393,166 | 899 |
| 55 | $4,345,968 | 890 |
| 56 | $4,299,620 | 880 |
| 57 | $4,254,093 | 871 |
| 58 | $4,209,357 | 862 |
| 59 | $4,165,386 | 853 |
| 60 | $4,122,154 | 844 |
| 61 | $4,079,637 | 835 |
| 62 | $4,037,811 | 827 |
| 63 | $3,996,654 | 818 |
| 64 | $3,956,146 | 810 |
| 65 | $3,916,265 | 802 |
| 66 | $3,876,994 | 794 |
| 67 | $3,838,313 | 786 |
| 68 | $3,800,205 | 778 |
| 69 | $3,762,653 | 770 |
| 70 | $3,725,642 | 763 |
| 71 | $3,689,155 | 755 |
| 72 | $3,653,179 | 748 |
| 73 | $3,617,700 | 741 |
| 74 | $3,582,703 | 733 |
| 75 | $3,548,176 | 726 |
| 76 | $3,514,106 | 719 |
| 77 | $3,480,481 | 713 |
| 78 | $3,447,291 | 706 |
| 79 | $3,414,523 | 699 |
| 80 | $3,382,167 | 692 |
| 81 | $3,350,213 | 686 |
| 82 | $3,318,652 | 679 |
| 83 | $3,287,473 | 673 |
| 84 | $3,256,667 | 667 |
| 85 | $3,226,226 | 660 |
| 86 | $3,196,141 | 654 |
| 87 | $3,166,404 | 648 |
| 88 | $3,137,007 | 642 |
| 89 | $3,107,941 | 636 |
| 90 | $3,079,201 | 630 |
| 91 | $3,050,778 | 625 |
| 92 | $3,022,666 | 619 |
| 93 | $2,994,858 | 613 |
| 94 | $2,967,347 | 607 |
| 95 | $2,940,127 | 602 |
| 96 | $2,913,192 | 596 |
| 97 | $2,886,537 | 591 |
| 98 | $2,860,155 | 586 |
| 99 | $2,834,040 | 580 |
| 100 | $2,808,189 | 575 |
| 101 | $2,782,594 | 570 |
| 102 | $2,757,251 | 564 |
| 103 | $2,732,156 | 559 |
| 104 | $2,707,303 | 554 |
| 105 | $2,682,689 | 549 |
| 106 | $2,658,307 | 544 |
| 107 | $2,634,154 | 539 |
| 108 | $2,610,226 | 534 |
| 109 | $2,586,519 | 530 |
| 110 | $2,563,028 | 525 |
| 111 | $2,539,750 | 520 |
| 112 | $2,516,680 | 515 |
| 113 | $2,493,816 | 511 |
| 114 | $2,471,153 | 506 |
| 115 | $2,448,687 | 501 |
| 116 | $2,426,417 | 497 |
| 117 | $2,404,337 | 492 |
| 118 | $2,382,446 | 488 |
| 119 | $2,360,739 | 483 |
| 120 | $2,339,214 | 479 |
| 121 | $2,317,867 | 475 |
| 122 | $2,296,697 | 470 |
| 123 | $2,275,699 | 466 |
| 124 | $2,254,871 | 462 |
| 125 | $2,234,210 | 457 |
| 126 | $2,213,714 | 453 |
| 127 | $2,193,380 | 449 |
| 128 | $2,173,205 | 445 |
| 129 | $2,153,188 | 441 |
| 130 | $2,133,325 | 437 |
| 131 | $2,113,614 | 433 |
| 132 | $2,094,053 | 429 |
| 133 | $2,074,640 | 425 |
| 134 | $2,055,372 | 421 |
| 135 | $2,036,248 | 417 |
| 136 | $2,017,264 | 413 |
| 137 | $1,998,420 | 409 |
| 138 | $1,979,713 | 405 |
| 139 | $1,961,141 | 401 |
| 140 | $1,942,702 | 398 |
| 141 | $1,924,394 | 394 |
| 142 | $1,906,215 | 390 |
| 143 | $1,888,164 | 387 |
| 144 | $1,870,239 | 383 |
| 145 | $1,852,438 | 379 |
| 146 | $1,834,760 | 376 |
| 147 | $1,817,202 | 372 |
| 148 | $1,799,763 | 368 |
| 149 | $1,782,441 | 365 |
| 150 | $1,765,235 | 361 |
| 151 | $1,748,144 | 358 |
| 152 | $1,731,166 | 354 |
| 153 | $1,714,298 | 351 |
| 154 | $1,697,541 | 348 |
| 155 | $1,680,892 | 344 |
| 156 | $1,664,350 | 341 |
| 157 | $1,647,914 | 337 |
| 158 | $1,631,583 | 334 |
| 159 | $1,615,354 | 331 |
| 160 | $1,599,227 | 327 |
| 161 | $1,583,200 | 324 |
| 162 | $1,567,273 | 321 |
| 163 | $1,551,444 | 318 |
| 164 | $1,535,712 | 314 |
| 165 | $1,520,075 | 311 |
| 166 | $1,504,533 | 308 |
| 167 | $1,489,084 | 305 |
| 168 | $1,473,727 | 302 |
| 169 | $1,458,461 | 299 |
| 170 | $1,443,286 | 295 |
| 171 | $1,428,199 | 292 |
| 172 | $1,413,201 | 289 |
| 173 | $1,398,289 | 286 |
| 174 | $1,383,464 | 283 |
| 175 | $1,368,723 | 280 |
| 176 | $1,354,066 | 277 |
| 177 | $1,339,493 | 274 |
| 178 | $1,325,001 | 271 |
| 179 | $1,310,591 | 268 |
| 180 | $1,296,261 | 265 |
| 181 | $1,282,010 | 262 |
| 182 | $1,267,838 | 260 |
| 183 | $1,253,744 | 257 |
| 184 | $1,239,726 | 254 |
| 185 | $1,225,784 | 251 |
| 186 | $1,211,918 | 248 |
| 187 | $1,198,125 | 245 |
| 188 | $1,184,407 | 242 |
| 189 | $1,170,761 | 240 |
| 190 | $1,157,187 | 237 |
| 191 | $1,143,684 | 234 |
| 192 | $1,130,252 | 231 |
| 193 | $1,116,890 | 229 |
| 194 | $1,103,597 | 226 |
| 195 | $1,090,372 | 223 |
| 196 | $1,077,215 | 221 |
| 197 | $1,064,124 | 218 |
| 198 | $1,051,100 | 215 |
| 199 | $1,038,142 | 213 |
| 200 | $1,025,248 | 210 |
| 201 | $1,012,419 | 207 |
| 202 | $999,654 | 205 |
| 203 | $986,951 | 202 |
| 204 | $974,311 | 199 |
| 205 | $961,733 | 197 |
| 206 | $949,216 | 194 |
| 207 | $936,760 | 192 |
| 208 | $924,363 | 189 |
| 209 | $912,026 | 187 |
| 210 | $899,748 | 184 |
| 211 | $887,529 | 182 |
| 212 | $875,367 | 179 |
| 213 | $863,262 | 177 |
| 214 | $851,214 | 174 |
| 215 | $839,222 | 172 |
| 216 | $827,286 | 169 |
| 217 | $815,405 | 167 |
| 218 | $803,579 | 165 |
| 219 | $791,807 | 162 |
| 220 | $780,088 | 160 |
| 221 | $768,422 | 157 |
| 222 | $756,810 | 155 |
| 223 | $745,249 | 153 |
| 224 | $733,740 | 150 |
| 225 | $722,282 | 148 |
| 226 | $710,875 | 146 |
| 227 | $699,519 | 143 |
| 228 | $688,212 | 141 |
| 229 | $676,955 | 139 |
| 230 | $665,747 | 136 |
| 231 | $654,588 | 134 |
| 232 | $643,477 | 132 |
| 233 | $632,413 | 129 |
| 234 | $621,397 | 127 |
| 235 | $610,428 | 125 |
| 236 | $599,506 | 123 |
| 237 | $588,629 | 121 |
| 238 | $577,799 | 118 |
| 239 | $567,014 | 116 |
| 240 | $556,274 | 114 |
| 241 | $545,578 | 112 |
| 242 | $534,927 | 110 |
| 243 | $524,320 | 107 |
| 244 | $513,757 | 105 |
| 245 | $503,236 | 103 |
| 246 | $492,759 | 101 |
| 247 | $482,323 | 99 |
| 248 | $471,931 | 97 |
| 249 | $461,580 | 94 |
| 250 | $451,270 | 92 |
| 251 | $441,001 | 90 |
| 252 | $430,774 | 88 |
| 253 | $420,587 | 86 |
| 254 | $410,440 | 84 |
| 255 | $400,333 | 82 |
| 256 | $390,265 | 80 |
For those who are premium subscribers I put together a pdf file breaking down the…
With only a few days before the 2024 NFL Draft, it's that time again to…
Every year as the draft approaches I like to look at different trends over the…
In this week's OTC Podcast: Devonta Smith signs a huge extension Eagles salary cap strategies…
In this week's OTC Podcast: The Bills trade Stefon Diggs Thoughts on the Jets offseason…
Adding to the intrigue surrounding the Texans trade for wide receiver Stefon Diggs, the Texans…