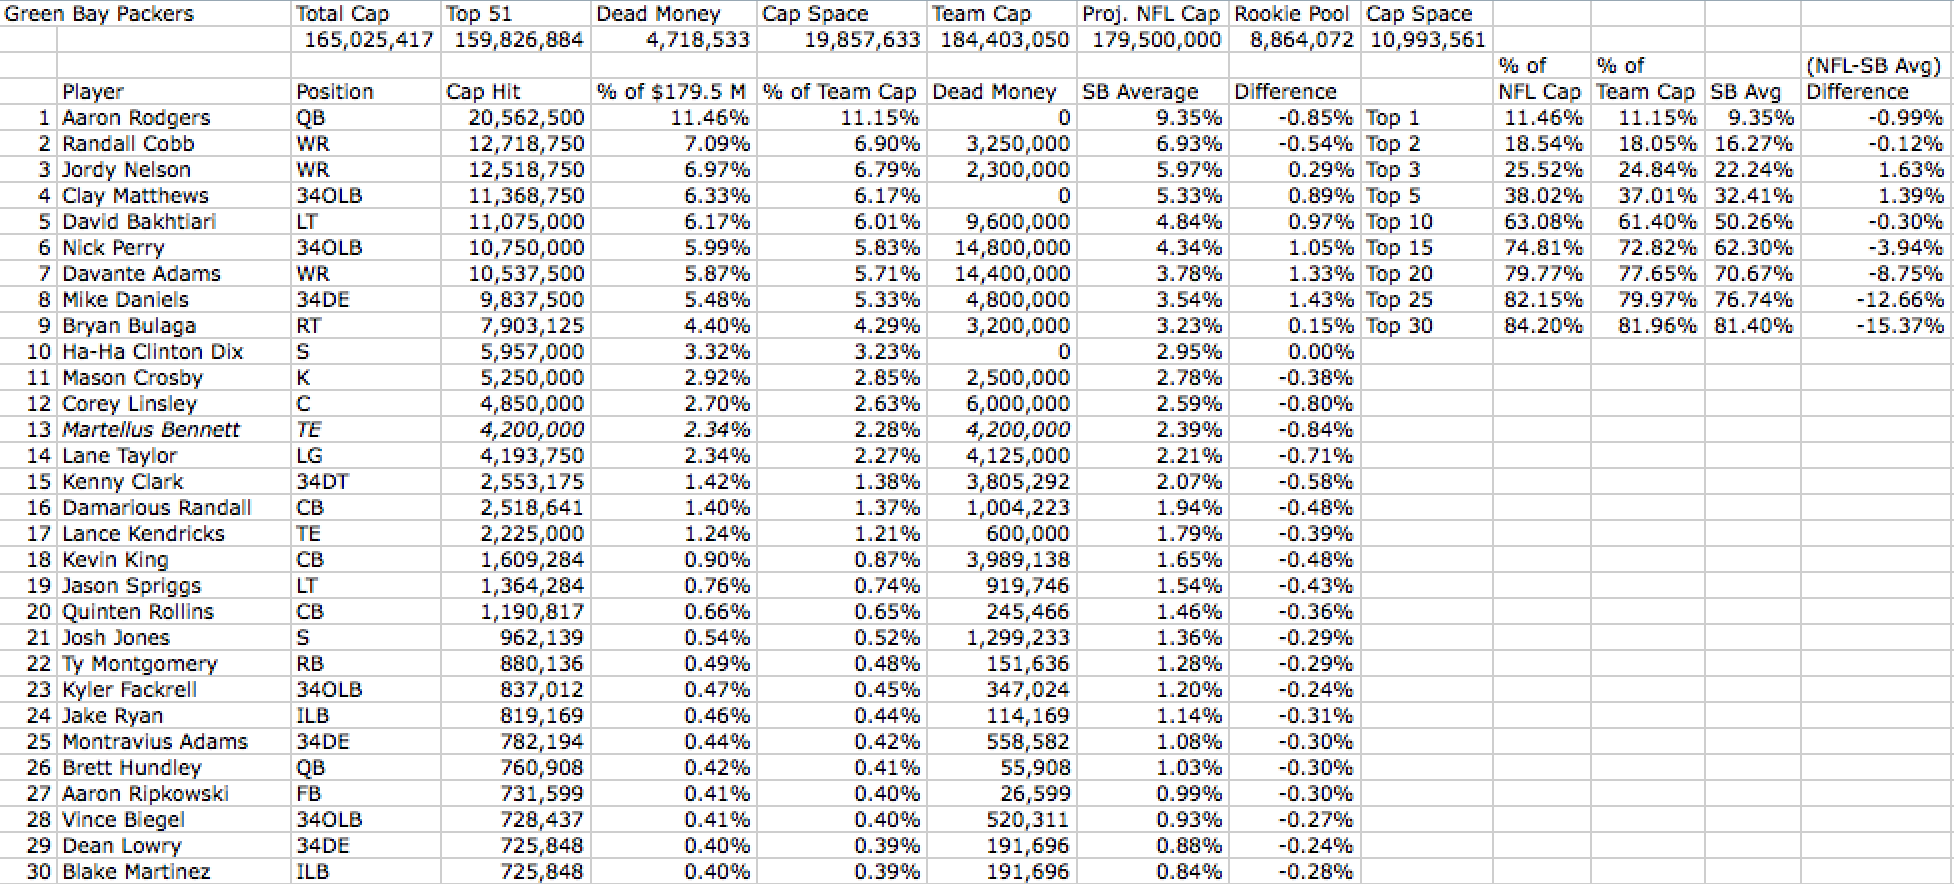
2018 Green Bay Packers (Cap Numbers as of 1/26; source Over The Cap.com; projected $179.5 M cap)
Continue reading Analyzing the Green Bay Packers 2018 Offseason »
2018 Green Bay Packers (Cap Numbers as of 1/26; source Over The Cap.com; projected $179.5 M cap)
Continue reading Analyzing the Green Bay Packers 2018 Offseason »
[adsenseyu1]
Welcome to one of the newest additions to the Over the Cap website: the offseason Financial Scouting Report, which should help serve as a guide to a teams’ offseason planning for the 2014 season. This will be our sixth report and will break down some thoughts on the Green Bay Packers. Each report will contain a breakdown of the current roster, a look at performance from 2013, salary cap outlooks, free agents, salary cap cuts, draft costs, extension candidates, and possible free agent targets. Due to time constraints I won’t be able to do all 32 teams, but we’ll see how far we can get in the next few weeks. Thus far we have covered the Jets, Dolphins, Texans, Giants, and Cowboys.
Because the report contains some graphs and charts and over 3,500 words it is available for download as an Adobe PDF file that you can read at your leisure offline and keep for a handy reference during the year rather than as a blog post. The report is free for download and reading, but if you find the report useful and would like to help OTC continue to grow and add content like this we would appreciate the “purchase” of the report for just $1.00 by clicking the Paypal link below or the one within the report. Also if using any of the graphs or salary data please just add a reference to OTC when doing so.

[adsenseyu2]
[adsenseyu4]
[subscribe2]
[adsenseyu1]
With three weeks of the NFL season behind us I thought it might be fun to compare salary cap spending versus performance. I keep my own team efficiency rankings, but they are based on scoring and strength of schedule and quite frankly not very reasonable at this stage of the season (for instance the Bills rank 2nd because they have faced 3 teams that have given up next to no points while the Bills are averaging 21+ a game and those numbers will even out once their schedule normalizes somewhat), so for this exercise I wanted to use Pro Football Focus’ data. Perhaps another time we will use some numbers from Football Outsiders.
I don’t like reprinting data from other sites and I usually like to use the data to come up with different numbers anyway so that was what I did here, so if you want to see the actual PFF grades you will need to subscribe to PFF. PFF scores teams in a number of offensive, defensive, and special teams categories. They usually give them equal weight sum them up and come up with an aggregate score for a team. I wanted to weight the categories with the passing categories having a weight of 56% and rushing categories 44%. These numbers simply represent the league wide play selection in 2012. I added 20% of the penalty grade assigned to each team to calculate an offensive and defensive score. A total grade was calculated by adding offense, defense, and special teams with the weights 42.5, 42.5, and 15.
I wanted to plot those scores against salary cap spending for the season and then add another dimension- unused cap space. So the following chart plots the score against spending with the bubble size representing unused cap room. A smaller bubble indicates minimal unused room while a larger one indicates significant unused dollars.
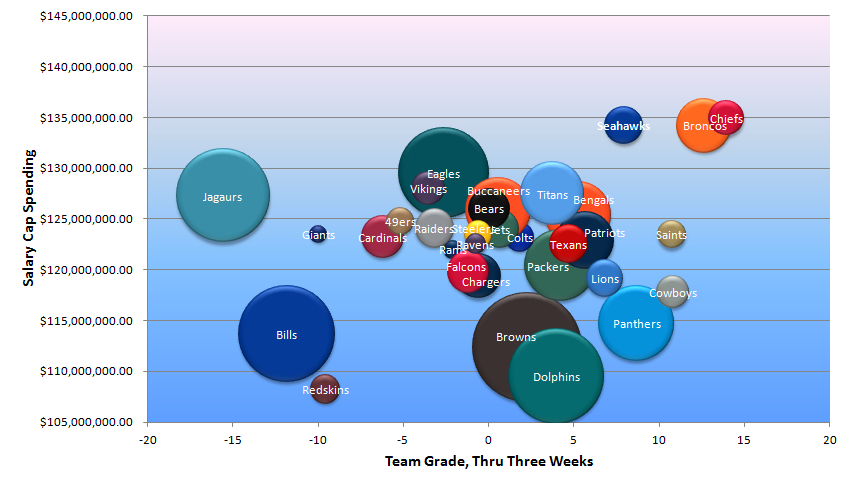
I admit I was a bit surprised at the results in that no low spending teams really broke through in the early stages of the season. The Chiefs, Broncos and Seahawks all have significant salary cap charges on the season. The Cowboys, Saints, and Panthers are all high payroll teams that have deferred significant costs to 2014 and beyond.
One of the more interesting teams could be Green Bay. The Packers offense is terrific. Under this grading criteria its just a few decimal points behind that of the Broncos, but their defense is 4th worst in the NFL. While they are not a team to spend heavily in free agency you have to wonder if they could have perhaps upgraded somewhere in that defense to improve their rankings.
The flipside of that is that the Packers have a pretty good team and will be able to carry over money next season to help them improve or maintain their roster in the future. The Patriots and Bengals would also fit in that same category. It’s probably the exact opposite for a team like the 49ers who is basically capped out and had to let some depth go this past year due to salary cap constraints.
Teams like the Raiders and Jets are actually impressive. The cap space is about average but both carry large amounts of dead money on the books and used almost all their cap resources to field what have at least been competitive teams.
Jaguars and to a lesser extent Bills fans probably have the most to gripe about in the early part of the year. Jacksonville is awful, maintains a high cap charge because of so much dead money but they still had tons of cap room to improve this team. To sit on that amount of cap space and be that bad has to rub a fan the wrong way. There had to be players out there that were at least upgrades, even in the short term than what they are currently presenting on the field. Carrying over huge amounts of cap space is all good, but eventually it gets to the point where it is so much it becomes useless.
The reason the Bills are a little different is because they decided to take a large cap hit in 2014 for former QB Ryan Fitzpatrick, so they will likely be using a good chunk of this cap room to cover for that charge. It’s still a nice amount of cap room they could have spent, but they at least have a purpose with their unused cap space.
As the season goes on I’ll so some more snapshots like this using various published criteria so if you have any sources you want me to consider using feel free to pass them along.
[subscribe2]
[adsenseyu1]
We keep track of the salary cap (or at least try to) on an everyday basis, so I thought it might be good to do a weekly recap of the effects of the weeks cap moves as we make a turn towards training camp time where the transaction sheet will likely begin to pick up pace.
Cincinnati Bengals– The Bengals signed DE Carlos Dunlap to a 5 year contract extension worth just under $40 million dollars and also locked up their first round draft pick Tyler Eifert to a standard 4 year deal. Dunlap’s contract was heavily frontloaded and cost the Bengals $5,418,200 in cap room. Between he and Eifert the Bengals spent $6,439,231in cap space. There should be no worries as the moves left them with nearly $15.55 million in cap room, 7th most in the NFL.
Green Bay Packers– The Packers extension of S Morgan Burnett reduced their 2013 cap space by $1,650,000, the amount of Burnett’s proration attributed to his $8.25 million dollar signing bonus. With $14.67 million in cap room the Packers have the 8th largest amount of unused cap in the NFL.
Denver Broncos– The Broncos lost $2.72 million in cap room with the signing of LT Ryan Clady to a heavily frontloaded contract and vesting future guarantees. Already counting $9.828 million against the cap the Broncos agreed to pay Clady a $10.5 million dollar roster bonus to keep his future charges low rather than looking to build carryover cap space this season. Denver has $7.39 million in cap room.
Jacksonville Jaguars– The Jaguars came to terms with rookie WR Ace Sanders on a four year contract. Jacksonville lost $45,362 in cap room following the signing. The Jaguars still have $22.9 million in cap space, 2nd most in the NFL.
Detroit Lions– The Lions gained $321,000 in cap room with the release of RB Jahvid Best and they will now carry $1.1 million in dead money on the 2014 salary cap. The Lions have $5.22 million in cap room.
Dallas Cowboys– The Cowboys gained $225,000 in cap room when Josh Brent retired. Dallas can also go after his proration from the year, $11,889, though I can’t imagine they would do so.
New England Patriots– The Patriots released WR Donald Jones to save themselves from paying a $200,000 reporting bonus due at the start of training camp. Jones was set to count for $1.131 million against the cap in 2013. Releasing him created $576,250 in cap space pushing the Patriots to $9.79 million.
Tampa Bay Buccaneers– The Buccaneers traded troubled cornerback Eric Wright to the San Francisco 49ers for a conditional late round pick. The Bucs got off great with Wright as off the field problems saw his guarantees for 2013 void, which allowed them to push him into a paycut. With more legal troubles Wright was sent packing creating $945,000 worth of cap space in the process. Tampa has he 4th most cap space in the league at $19.22 million.
San Francisco 49’ers– The 49’ers were on the other end of the trade with the Bucs, taking on Eric Wright and his $1.5 million dollar salary. The addition of Wright reduced San Francisco’s cap room by $945,000. The 49’ers now have $4.49 million in cap room and limited space in 2014, fueling speculation that the team may cut CB Carlos Rogers, saving over $4 million in 2013 and $5.1 million in 2014, giving the team much more breathing room as they prepare for an extension with QB Colin Kaepernick after the season.
St. Louis Rams– With just $214,088 in cap room the Rams do not have enough cap space to function once the regular season begins. They will need to restructure contracts or make a few cuts to be able to function in the regular season.
Washington Redskins– At $1.4 million in cap space the Redskins have the 2nd least amount of space in the NFL. Once rosters expand to 53 and teams spend $1 million on a practice squad the Redskins will be forced to make moves to be cap compliant in September. They should have over $10 million in cap room in 2014 so they may look to push some money into next year if they do not want to make any cuts.
Houston Texans– Houston still needs to sign their first three draft picks, which will eat into their $2.8 million in cap room leaving them with around $1.6 million in room when the season begins. Add in two contracts and a Practice Squad and you get the idea- Houston can’t stand pat and do nothing over the next few weeks.
[adsenseyu2]
[subscribe2]
[adsenseyu1]
New Podcast covering the Dolphins, the Eagles and DeSean Jackson, plus some thoughts on which teams had the best and worst offseasons in terms of salary cap moves.
Podcast: Play in new window | Download
Subscribe: RSS
[adsenseyu1]
Yesterday we discussed the key metrics to look for when really valuing the Clay Matthews contract and now that the numbers are out per the Milwaukee Journal Sentinel we can put the numbers a bit in perspective compared to the Ware and Suggs contracts we focused on.
Despite the lofty totals of Matthew’s extension his contract is significantly less player friendly than the other contracts. First of all Matthews has $2.5 million tied up in per game roster bonuses, a major win for the Packers. Neither Mario Williams nor Julius Peppers, the two higher level defensive contracts, have such provisions nor do the Suggs and Ware contracts at the positions. In terms of cash flows here is how Matthews stacks up against Ware and Suggs:
Ware | Ware Total | Suggs | Suggs Total | Matthews | Matthews Total | |
| Year 1 | $32,800,000 | $32,800,000 | $15,100,000 | $15,100,000 | $25,250,000 | $25,250,000 |
| Year 2 | $7,200,000 | $40,000,000 | $24,900,000 | $40,000,000 | $8,600,000 | $33,850,000 |
| Year 3 | $5,000,000 | $45,000,000 | $3,400,000 | $43,400,000 | $9,650,000 | $43,500,000 |
| Year 4 | $6,000,000 | $51,000,000 | $4,900,000 | $48,300,000 | $11,100,000 | $54,600,000 |
| Year 5 | $12,750,000 | $63,750,000 | $6,400,000 | $54,700,000 | $11,400,000 | $66,000,000 |
| Year 6 | $14,250,000 | $78,000,000 | $7,800,000 | $62,500,000 | NA | NA |
The key numbers here are the 2 and 3 year totals. His two year takehome of $33.85 million pales in comparison to the $40 million made by Ware and Suggs. Its 15% less salary than those two players earned in their first two new money years. His 3 year takehome barely eclipses that of Suggs and falls short of Ware by $1.5 million and these numbers are assuming he plays all 16 games for the Packers. It is really the backend of the contract in year 4 and 5 where he pulls away from Ware and Suggs in pay. As is often the case in the NFL these backend salaries are rarely earned and nothing more than fluff in a contract.
That brings us to functional guarantees. I stated in yesterdays piece that Ware had a functional guarantee of $40 million while Suggs had one worth $48.3 million. There was a strong probability that Ware would earn $45 million and Suggs just over $54 million. Here is how Matthew’s contract plays out:
Base | Prorated Money | Misc. | Cap Number | Dead | Savings | |
| Year 1 | $1,000,000 | $4,100,000 | $6,000,000 | $11,100,000 | $16,400,000 | ($5,300,000) |
| Year 2 | $7,600,000 | $4,100,000 | $1,000,000 | $12,700,000 | $12,300,000 | $400,000 |
| Year 3 | $8,650,000 | $4,100,000 | $1,000,000 | $13,750,000 | $8,200,000 | $5,550,000 |
| Year 4 | $10,100,000 | $4,100,000 | $1,000,000 | $15,200,000 | $4,100,000 | $11,100,000 |
| Year 5 | $10,400,000 | $0 | $1,000,000 | $11,400,000 | $0 | $11,400,000 |
The only year of the extension fully protected by dead money is the first year of the deal, though with such minimal savings I would consider year 2 protected as well. That would make the functional guarantee similar to Ware’s in that it only lasts two seasons. By year 3 he becomes fair game if the play declines badly. I fool around at times with a number you see on the site called a CSC ratio which is the cap savings plus cash savings divided by the cap hit for a player. Basically it tells you if you gain something positive with a cut and once the ratio goes over 1 the power sways towards the team. Matthews is at a 1.11 by year 3 of his deal, while Ware was at 0.66. Suggs was in negative terms due to the lack of cap savings associated with a cut at the time. In Year 4 Ware jumped to a 1.2 and Suggs didn’t reach close to Matthews’ Year 3 number until the 6th year of his contract. In terms of protection Matthews’ deal doesn’t rank close.
So while Matthews will go down as the player with the highest annual value at the position the contract itself is much more reflective of the downturn in the NFL market. In real terms he is earning less than both Ware and Suggs, and its actually pretty significant. He has almost no protection it would seem beyond 2015, the third extension year of his contract. The other players were far more protected. Maybe some new details emerge today regarding ways he can earn more protection or more money, but based on the initial reports Matthews is highest paid in name only, but in the key valuation points this is not the top of the market deal it appears to be.
[adsenseyu2]
[adsenseyu1]
After weeks of rumored contract negotiations between the Green Bay Packers and LB Clay Matthews, the two sides made it official that Matthews would not become the highest paid outside linebacker in the NFL, surpassing the $13 million per year that the Cowboys DeMarcus Ware received in his 2009 contract extension. While no numbers are in as I am writing this (who knows by the time I’m finished) I wanted to look at the two real benchmark deals ahead of time so that we can get a better idea of just how strong the contract really is. The two deals I want to look at are those of Ware and the Ravens’ Terrell Suggs.
When I evaluate high level deals like this for the site I like to look at two sets of numbers- yearly cash flow and functional guarantees. The cash flows are pretty self explanatory. Functional guarantees are the amount of money that a player will actually earn not just because of the guarantee but because of the structure of the contract which comes with prorated bonus protections that leads to excessive dead money if cut.
Ware’s case is more similar to Matthews in that both were currently under contract to their teams on rookie contracts when they signed their extensions. Suggs had gone beyond the rookie deal and was on a franchise tag. The following cash flows represent the new money totals per year for the players
Ware | Ware Total | Suggs | Suggs Total | |
| Year 1 | $32,800,000 | $32,800,000 | $15,100,000 | $15,100,000 |
| Year 2 | $7,200,000 | $40,000,000 | $24,900,000 | $40,000,000 |
| Year 3 | $5,000,000 | $45,000,000 | $3,400,000 | $43,400,000 |
| Year 4 | $6,000,000 | $51,000,000 | $4,900,000 | $48,300,000 |
| Year 5 | $12,750,000 | $63,750,000 | $6,400,000 | $54,700,000 |
| Year 6 | $14,250,000 | $78,000,000 | $7,800,000 | $62,500,000 |
The first benchmark for Matthews is clearly the $40 million over a two year period, matching what both Ware and Suggs received. Ware’s number is a bit more misleading since it actually took him 3 years to reach $40 million due to the prior year contract not counting in the calculation. If Matthews surpasses $45 million over his first three extension years he will get the best deal of the group. Matthews was already set to earn over $3 million this season which would mean his 4 year total would surpass Suggs’ 4 year if he gets $45 million over the first three new years of the contract. Ware’s contract was filled with big money at the end which normally wont be earned which is why I want to go to the functional guarantees next, first with Ware and then with Suggs.
Ware:
Base | Prorated Money | Misc. | Cap Number | Dead | Savings | |
| Year 1 | $7,800,000 | $5,430,693 | $0 | $13,230,693 | $25,226,772 | ($11,996,079) |
| Year 2 | $6,700,000 | $3,998,693 | $500,000 | $11,198,693 | $11,996,079 | ($797,386) |
| Year 3 | $4,500,000 | $3,998,693 | $500,000 | $8,998,693 | $7,997,386 | $1,001,307 |
| Year 4 | $5,500,000 | $3,998,693 | $500,000 | $9,998,693 | $3,998,693 | $6,000,000 |
| Year 5 | $12,250,000 | $0 | $500,000 | $12,750,000 | $0 | $12,750,000 |
| Year 6 | $13,750,000 | $0 | $500,000 | $14,250,000 | $0 | $14,250,000 |
Suggs:
Base | Prorated Money | Misc. | Cap Number | Dead | Savings | |
| Year 1 | $1,000,000 | $2,020,000 | $4,000,000 | $7,020,000 | $14,100,000 | ($7,080,000) |
| Year 2 | $1,900,000 | $6,620,000 | $0 | $8,520,000 | $31,080,000 | ($22,560,000) |
| Year 3 | $3,400,000 | $6,620,000 | $0 | $10,020,000 | $24,460,000 | ($14,440,000) |
| Year 4 | $4,900,000 | $6,620,000 | $0 | $11,520,000 | $17,840,000 | ($6,320,000) |
| Year 5 | $6,400,000 | $6,620,000 | $0 | $13,020,000 | $11,220,000 | $1,800,000 |
| Year 6 | $7,800,000 | $4,600,000 | $0 | $12,400,000 | $4,600,000 | $7,800,000 |
This actually drives home a major difference between the two contracts. The fact that Suggs got massive prorated bonus money rather than base salary guarantees in the first two years of his deal make him virtually uncuttable for the first 4 years of his contract and even Year 5 is a difficult choice. This would be a functional guarantee of $48.3 million with a decent chance of earning $54.7 million before being released.
Ware, before Jerry Jones went wild with the restructures, did not have that protection upon signing. In this case I would consider the first two years functionally guaranteed with a decent chance of the third year being earned. So the reality is its $40 million and a good chance at $45. If his play trailed off he would have been a prime candidate for a restructure in year 4 and easily cut beyond that. In reality his year 5 and 6 were nothing but funny money. Now Dallas has virtually guaranteed the whole contract because of their cap problems, but when signed Suggs had the far better contract structure despite lower money totals.
For Matthews to come out on top of the market he needs a structure that is closer to that of Suggs. Something that functionally guarantees him those first four years and a great chance at 5 years. If he can reach that $51 million over 4 year plateau and have a structure that makes it difficult for the Packers to wave good bye in 2018 he will truly have the best contract in recent memory at the position. If the Packers have outs early on and his cash flow is similar to that of Ware it may be a case where it’s a deal that looks better on paper than it plays out in real life, especially since the Packers are not going to get in a deep mess the way the Cowboys did.