NFL 2019 Snap-shot: 2020 UFA usage through 9 Weeks

Follow me on Twitter @BradOTC

We are now halfway through the 2019 NFL season and the trade deadline is officially in the rear view mirror. Most rosters are pretty set at this point, though there will of course always be minor roster shuffling throughout the season.

I wanted to update the previous snaps article (read here) and add some new data into the fold.

Using the new OTC Valuation Metric, I compiled the Current APYs of each team’s UFAs. Next, I have the Positional Value for each player as determined by the new OTC Valuation Metric. Finally, there is the Value Over Current APY.

I wanted to add our new valuation component because, as I mentioned in the original article, not all snaps are created equal. The valuation metric puts a dollar amount on the players that are headed out the door after 2019. We can see which teams are paying more than they need to for certain players based on their production halfway through the season, and if they shouldn’t be too worried about replacing them in free agency at the right price. On the flip side, we can see which teams are getting quality production out of a currently cheap asset that will soon cost much more. The proprietary OTC Valuation metric was created by OTC in partnership with Pro Football Focus).

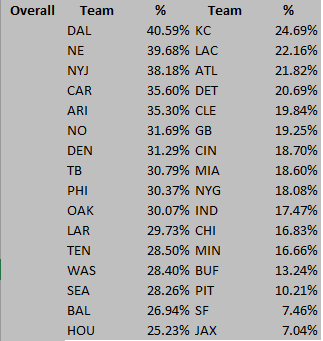
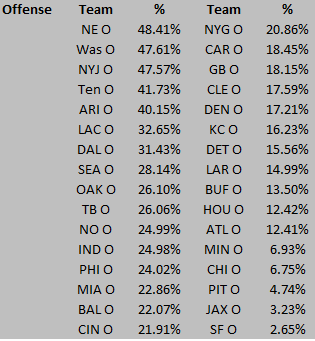
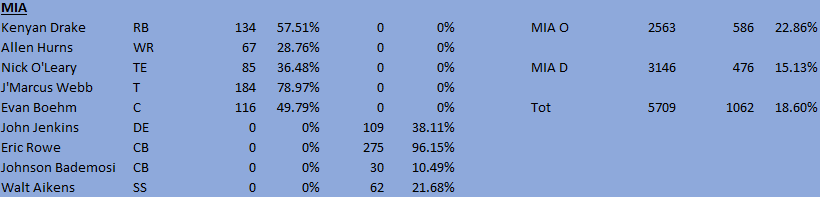
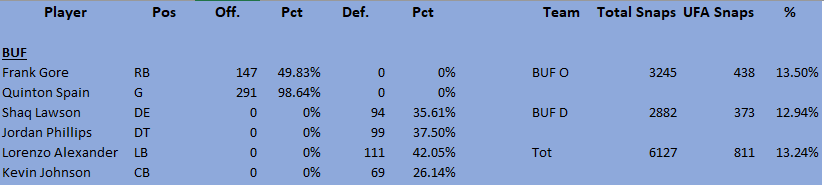
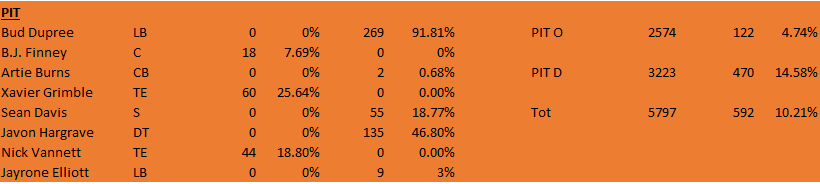
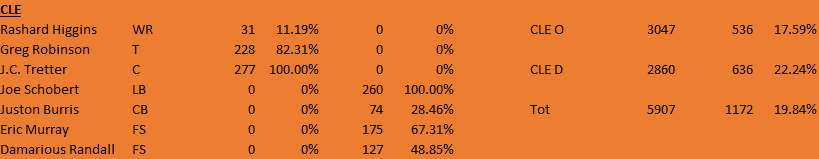
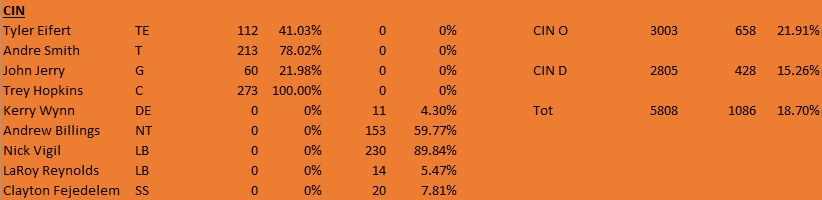
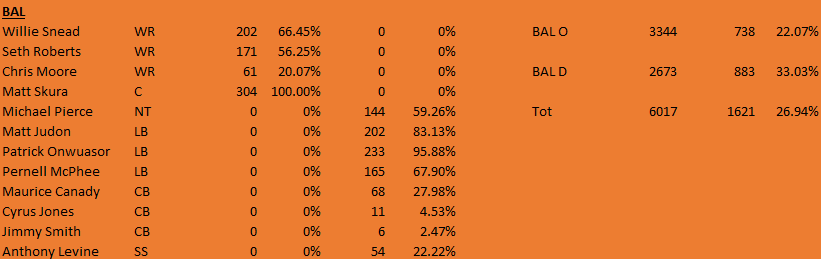
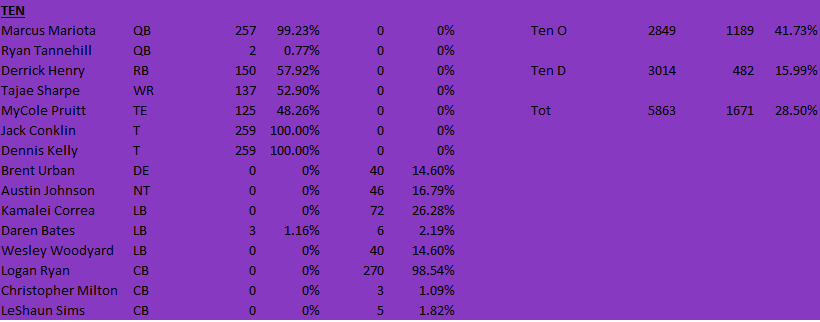
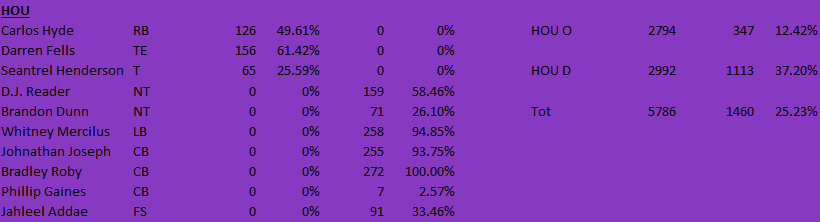
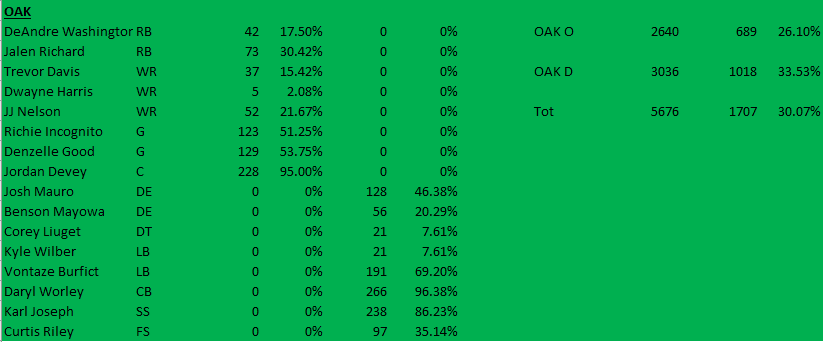
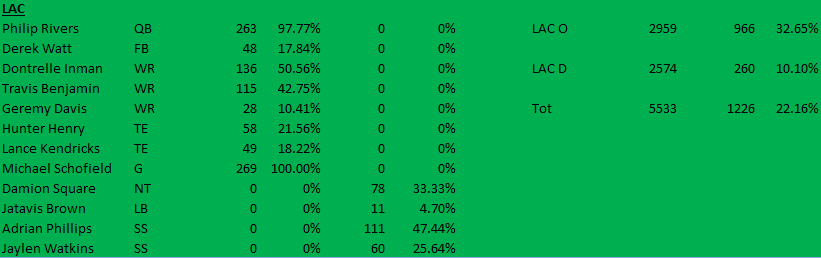
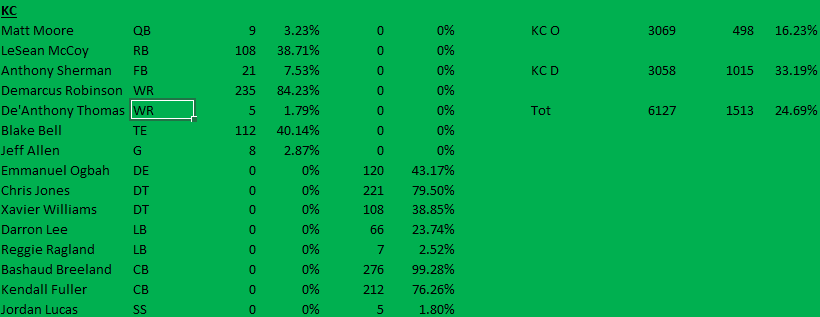
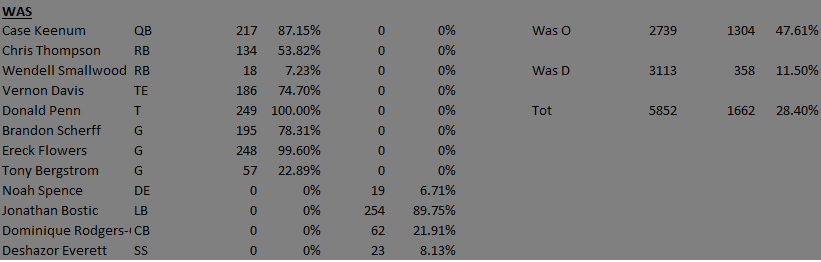
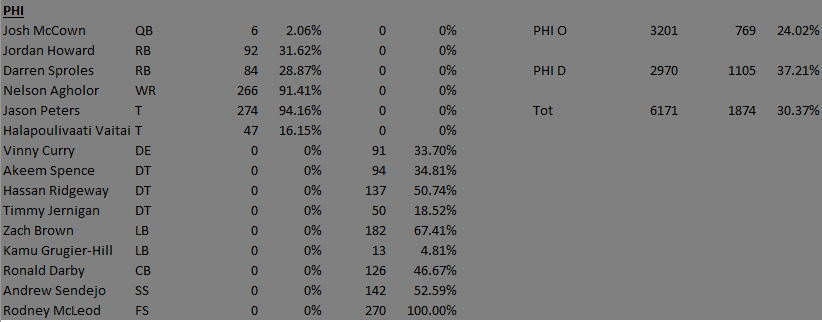
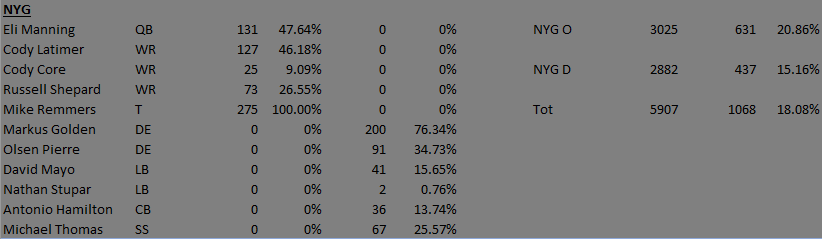
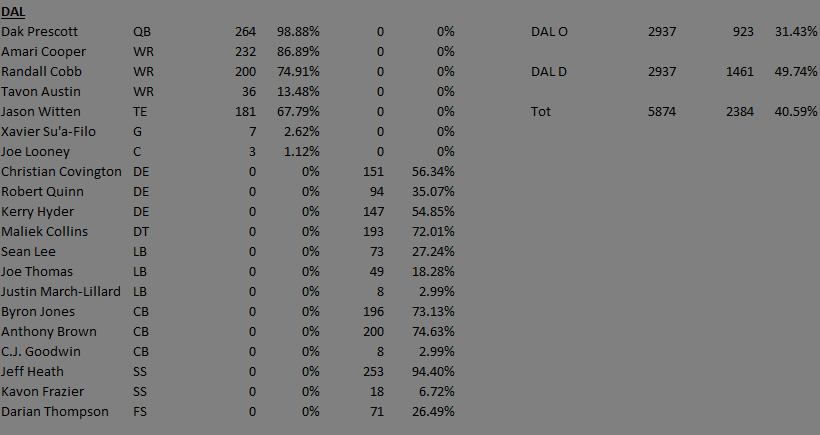
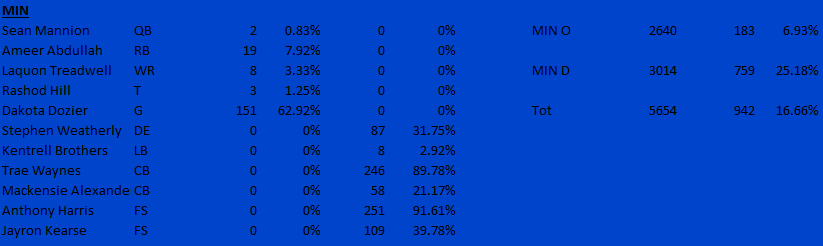
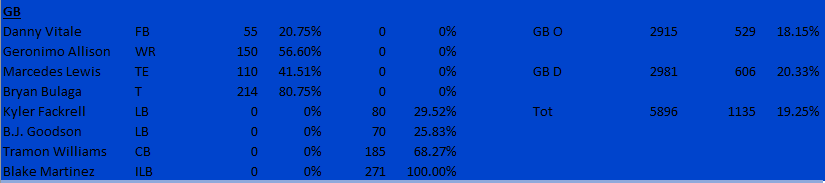
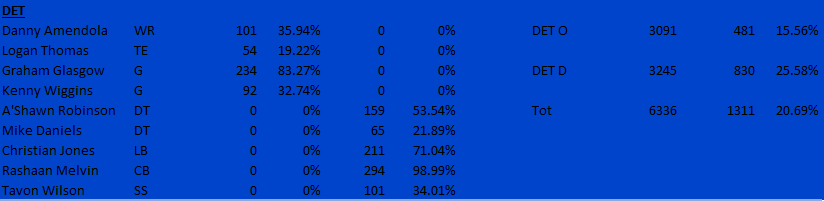
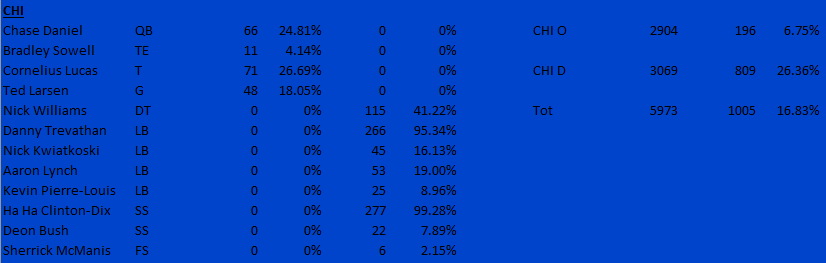
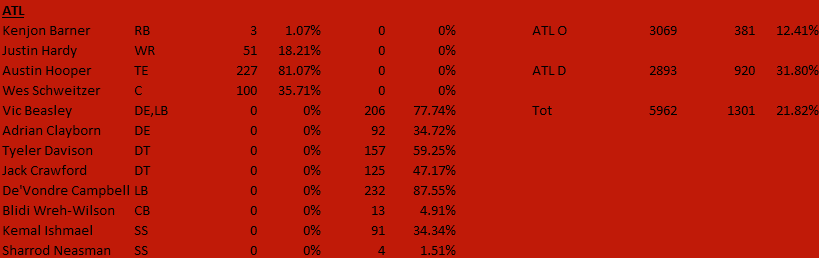
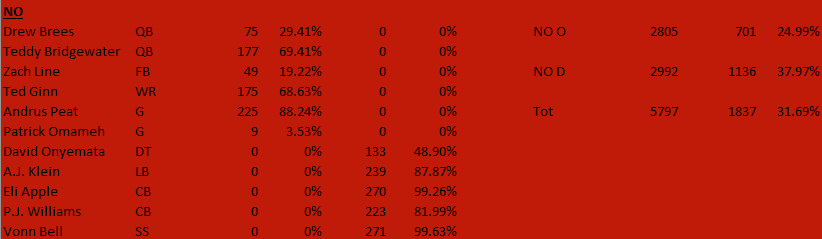
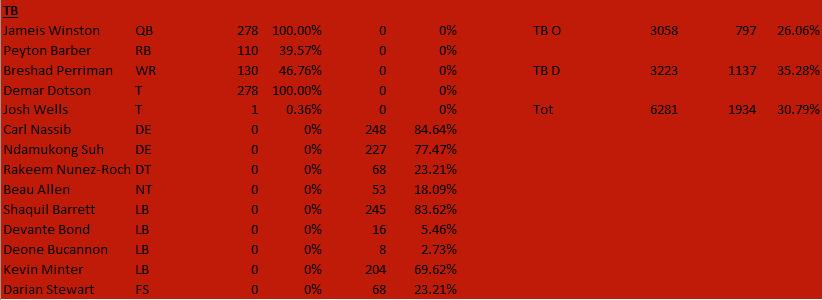
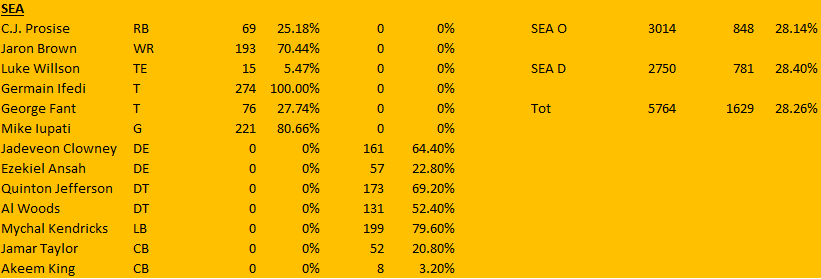
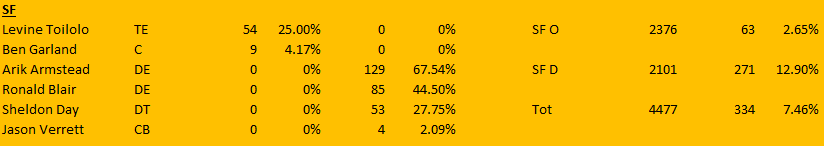
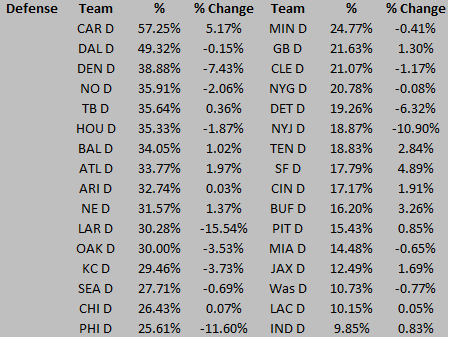
First, here are updated tables for offense, defense and overall snaps attributed to 2020 UFAs for each team (% Change from Weeks 1-4):

Overall Snaps (Offense + Defense) by 2020 UFAs Weeks 1-9
Offense Snaps by 2020 UFAs Weeks 1-9
Defense Snaps by 2020 UFAs Weeks 1-9

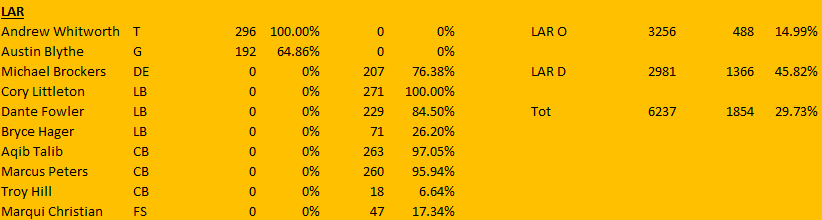
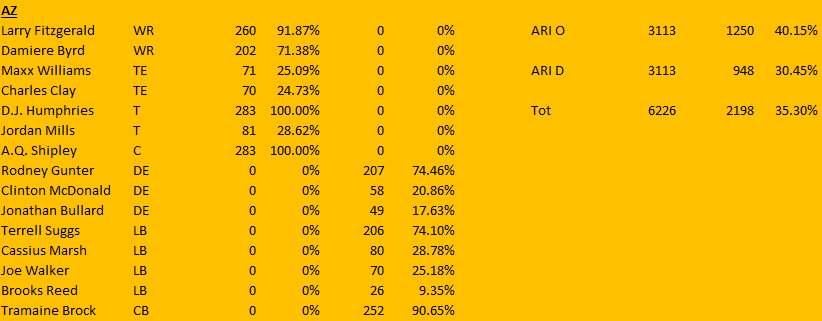
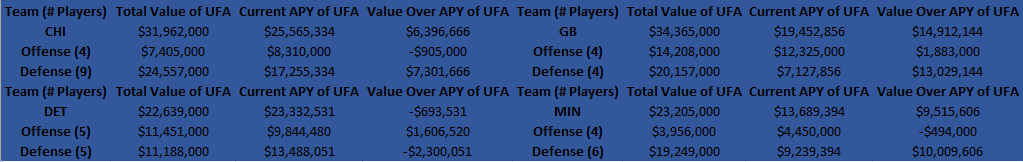
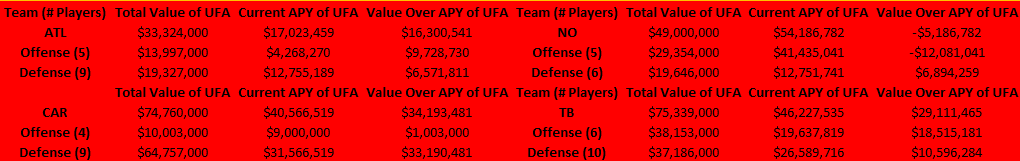
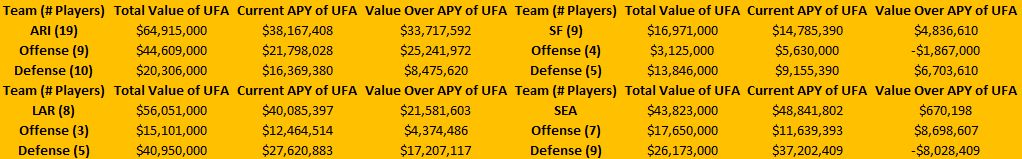
Next, I broke each team’s UFAs down according to the OTC Valuation Metric following the first nine weeks of the season (there have been 135 of the 256 total NFL regular season games played thus far).

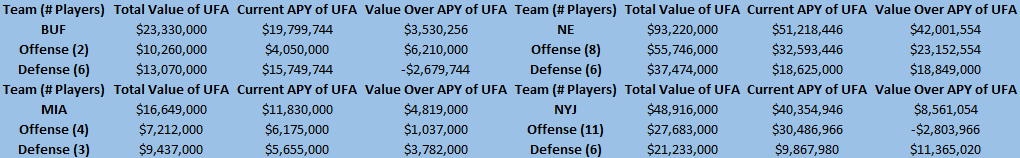
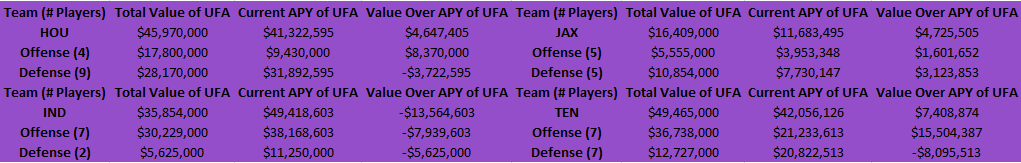
“Total Value of UFA” is the sum of all of the UFAs “Positional Values” (no special teams) through nine weeks of the regular season.

“Current APY of UFA” is the sum of the current average per year of each of the UFAs contracts.

“Value Over APY of UFA” is the Total Value of UFA less the Current APY of UFA

A positive Value Over APY means the team is currently paying less (on a per-year basis) to their pending 2020 UFAs than our OTC Valuation Metric believes the players are worth (based on their play in the current season). These are players that are contributing quality snaps at their position and the team may look to re-sign.

A negative Value Over APY means the team is currently paying more (per-year) to their pending 2020 UFAs than our OTC Valuation Metric believes the players are worth (based on 2019 production). These are players that are contributing snaps, but not to the caliber of their contract, or those who have been unable to register many snaps to generate value.

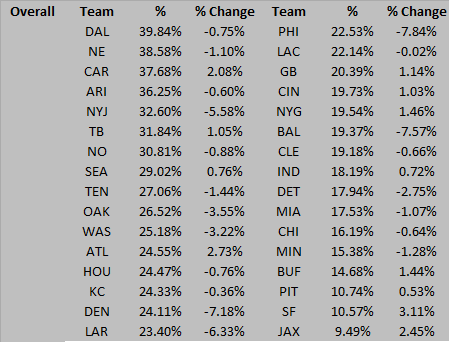
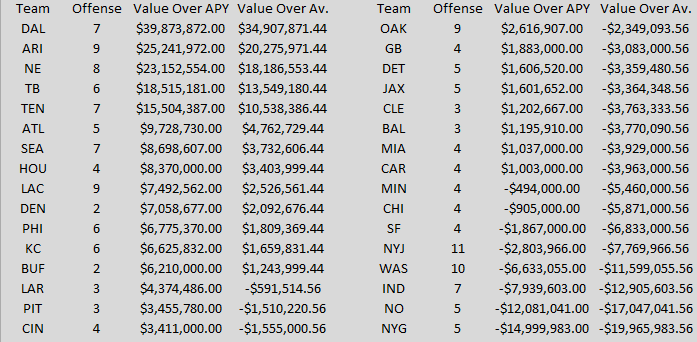
To put the team tables (below) into perspective, first here are some leaguewide numbers for Value Over APY (“Overall,” “Offense,” and “Defense” list the # of players):

Overall:

Overall Team Value Over APY

The average Value Over APY for a full NFL roster is $10,824,088, with an average of 12.28 UFAs per team.

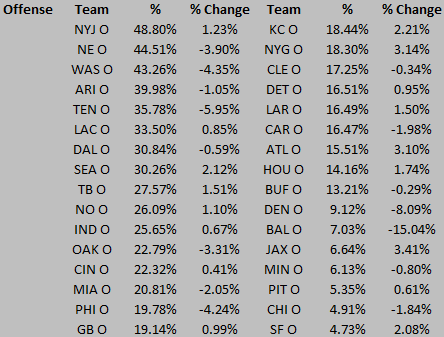
The average Value Over APY for offenses is $4,966,000.56, with an average of 5.47 UFAs per team.

The average Value Over APY for defenses is $5,790,450.72, with an average of 6.81 UFAs per team.

Based on the OTC Valuation metric, Dallas has production from UFAs worth $44 million more than the average NFL team. They have a lot of quality players they need to re-sign. On the other end of the spectrum, Indianapolis is paying more to their pending 2020 UFAs than their production dictates they are worth, so they will probably have no issue letting some of those players walk.

Offense:

Offense Value Over APY

Defense:

Defense Value Over APY

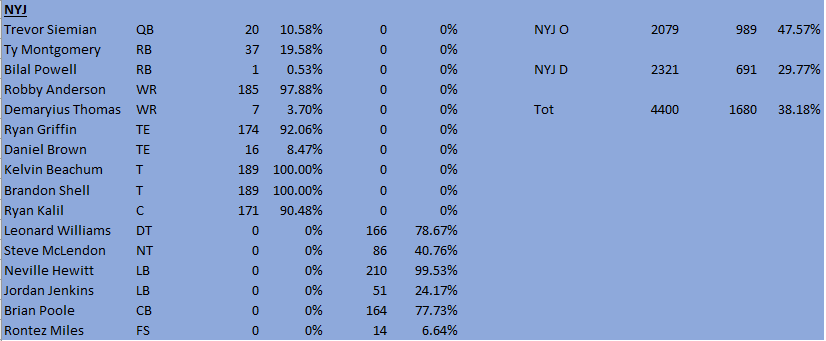
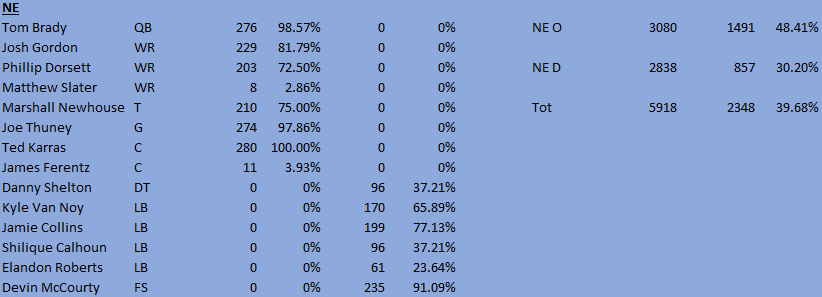
Here is each team broken down by division. The Rows are the team overall, then the offense (# of UFAs on Offense), and the defense (# of UFAs on Defense). :

AFC East
AFC North
AFC South
AFC West
NFC East
NFC North
NFC South
NFC West

Finally, I took a look at our projected 2020 Cap Space for each team as compared to their 2020 UFA Value Over APY:

This demonstrates how much cap space would remain if the team signed all of their UFAs to contracts worth what the OTC Valuation Metric has deemed the players’ true worth. No team will do this, but it gives you a better idea of each team’s situation as they approach free agency. For example, Tampa Bay and Arizona have 16 and 19 UFAs respectively. The UFA groups on each team are outperforming their contracts by about $30 million collectively in 2019. However, Tampa Bay has $82.5 million and Arizona has $79.4 million in projected 2020 cap space. So, if they were to sign all of their UFAs to contracts in accordance with the OTC Valuation Metric, they would still have $53.4 million and $45.7 million respectively.

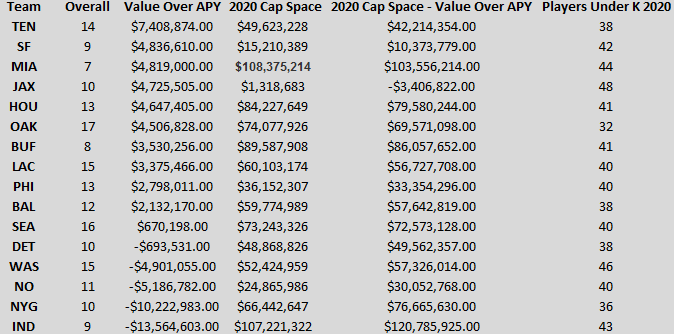
On the other hand, teams like the Giants and Colts will likely be letting the majority of their 2020 UFAs walk, and are more likely to benefit from replacing those players on the roster with others.

Follow me on Twitter @BradOTC

NFL 2019 Snap-shot: 2020 UFA usage through 4 Weeks

Follow me on Twitter @BradOTC

Through one quarter of the NFL season, I wanted to take a look at which teams are giving the most playing time to pending unrestricted free agents (I included players with a 2020 Void Year as UFAs).

All snaps are not created equal, and an injury may have thrust a particular player into a larger role, even though that is not necessarily a good thing for the team. Therefore, it is not automatically a red flag if a team has a lot of UFAs contributing significantly (especially if the team has performed poorly thus far). 

Nevertheless, teams must plan ahead. Certain position groups with several UFAs seeing a lot of snaps could raise eyebrows for a front office. Draft picks and/or free agency dollars could be earmarked based on early 2019 production. 

With that said, I broke down the team-specific positions to keep an eye on.

First, here are the league-wide numbers:

Overall Team Snaps for 2020 UFAs: 

Offensive Snaps for 2020 UFAs:

Defensive Team Snaps for 2020 UFAs:

The breakdown for each team with each player is below. I have also included the projected 2020 Cap Space for each team below:

Columns: Player | Position | Off. Snaps | % of Total | Def. Snaps | % of Total

AFC East

NYJ – $53.7M 2020 Cap Space (34 Players currently under Contract for 2020 – $45M Effective Cap Space)

NE – $45.7M 2020 Cap Space (46 Players currently under Contract for 2020 – $43.1M Effective Cap Space)

MIA – $115M 2020 Cap Space (41 Players currently under Contract for 2020 – $110M Effective Cap Space)

BUF – $86.7M 2020 Cap Space (44 Players currently under Contract for 2020 – $83.1M Effective Cap Space)

AFC North

PIT – $2.4M 2020 Cap Space (41 Players currently under Contract for 2020 – (-$2.66M) Effective Cap Space)

CLE – $61.2M 2020 Cap Space (47 Players currently under Contract for 2020 – $59.2M Effective Cap Space)

CIN – $60.6M 2020 Cap Space (41 Players currently under Contract for 2020 – $55.5M Effective Cap Space)

BAL – $68.9M 2020 Cap Space (39 Players currently under Contract for 2020 – $62.7M Effective Cap Space)

AFC South

TEN – $50.4M 2020 Cap Space (38 Players currently under Contract for 2020 – $43.8M Effective Cap Space)

JAX – (-$10.5M) 2020 Cap Space (46 Players currently under Contract for 2020 – (-$13M) Effective Cap Space)

IND – $108.9M 2020 Cap Space (42 Players currently under Contract for 2020 – $104.3M Effective Cap Space)

HOU – $88.8M 2020 Cap Space (39 Players currently under Contract for 2020 – $82.7M Effective Cap Space)

AFC West

OAK – $78.7M 2020 Cap Space (33 Players currently under Contract for 2020 – $69.5M Effective Cap Space)

LAC – $62.8M 2020 Cap Space (38 Players currently under Contract for 2020 – $56.1M Effective Cap Space)

KC – $23.6M 2020 Cap Space (40 Players currently under Contract for 2020 – $18M Effective Cap Space)

DEN – $67M 2020 Cap Space (37 Players currently under Contract for 2020 – $59.9M Effective Cap Space)

NFC East

WAS – $53.4M 2020 Cap Space (45 Players currently under Contract for 2020 – $50.3M Effective Cap Space)

PHI – $39.3M 2020 Cap Space (36 Players currently under Contract for 2020 – $31.7M Effective Cap Space)

NYG – $65.2M 2020 Cap Space (37 Players currently under Contract for 2020 – $58.1M Effective Cap Space)

DAL – $92.6M 2020 Cap Space (36 Players currently under Contract for 2020 – $85M Effective Cap Space)

NFC North 

MIN – (-$1.2M) 2020 Cap Space (37 Players currently under Contract for 2020 – (-$8.4M) Effective Cap Space)

GB – $25.1M 2020 Cap Space (41 Players currently under Contract for 2020 – $20.1M Effective Cap Space)

DET – $46.4M 2020 Cap Space (36 Players currently under Contract for 2020 – $38.8M Effective Cap Space)

CHI – $14.6M 2020 Cap Space (35 Players currently under Contract for 2020 – $6.5M Effective Cap Space)

NFC South

ATL – (-$8M) 2020 Cap Space (40 Players currently under Contract for 2020 – (-$13.6M) Effective Cap Space)

CAR – $51.6M 2020 Cap Space (37 Players currently under Contract for 2020 – $44.5M Effective Cap Space)

NO – $27.1M 2020 Cap Space (39 Players currently under Contract for 2020 – $20.1M Effective Cap Space)

TB – $82M 2020 Cap Space (37 Players currently under Contract for 2020 – $74.9M Effective Cap Space)

NFC West

SEA – $75.4M 2020 Cap Space (40 Players currently under Contract for 2020 – $69.8M Effective Cap Space)

SF – $26.4M 2020 Cap Space (42 Players currently under Contract for 2020 – $21.8M Effective Cap Space)

LAR – $37.2M 2020 Cap Space (39 Players currently under Contract for 2020 – $31.1M Effective Cap Space)

AZ – $83.3M 2020 Cap Space (32 Players currently under Contract for 2020 – $73.6M Effective Cap Space)

Each team has their own pressing needs, but they also have financial realities they have to deal with moving forward. The rest of the season will go a long way in determining priority extensions and which players teams will let walk. However, the lineup a team rolls out in Week 1 (again, excluding injuries) is the lineup they determined was optimal after Training Camp. We can certainly learn from these figures through four weeks.

As seen on Colin Cowherd’s The Herd