With Dak Prescott having signed a record breaking contract the focus immediately turned to the future of the Cowboys and how will they keep things together. Speculation started about when they will exit the contracts of players like Amari Cooper, Ezekiel Elliott, and others. It’s probably a bit early for that conversation (and Dallas signed those deals knowing they would have an expensive QB), but that got me to thinking a bit. Do teams pull back significantly on their payroll once the QB comes into the fold?
I’ve had this discussion before with people in and out of the league and usually we just speak of the general concept of going “all in” when you have the rookie QB contract because you have so much saved on that particular player. But does the data suggest that teams really pull back that much further when they sign a big time QB? I wasn’t sure if it did or did not so let’s take a look.
First I went back and studied the payroll of every team from 2015 to 2020 and pulled the spending of all quarterbacks out of the payroll unless it was cash spent as dead money. I then wanted to compare that level of spending to the annual contract value committed to the highest paid QB on the roster that year.
Initially I was just going to plot those numbers but since the salary cap and revenues constantly rise I thought that would give some false information since it would be valuing a $22M contract now the same as when someone like Matt Ryan was playing around that salary. So I really needed to adjust for the salary cap. So what I did was determine the non-QB payroll as a percentage of the cap in that given year and then converted the players annual contract value to a percentile based on the cap. This can also help take into account the concept that an expensive contract today won’t look as expensive down the line. Here were the results.
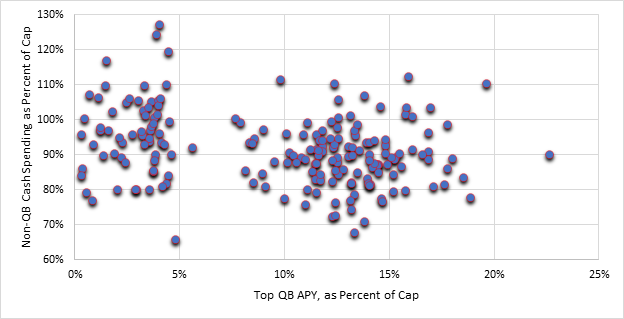
There is some weak evidence that teams that spend higher on QB will spend less on their roster but these are all single seasons and teams sometimes will go nuts one year and back off the rest which can make things look different. Basically in any given year a team can make things work under any salary level, but the cap does eventually become an equalizer and over time we can see the spending stabilize. Here is the data plotted as four year spending averages (2015-2018, 2016-2019, etc…) for each team in the league.
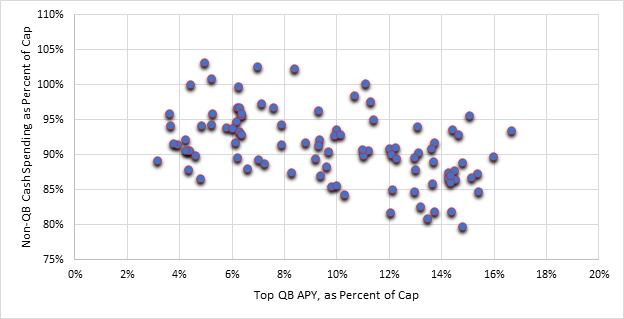
Here you can see just how the trends over time do show more of an inclination to drop spending once you spend on the QB as the longer term view takes the swings out of the equation. What if we look at the entire six year timeframe?
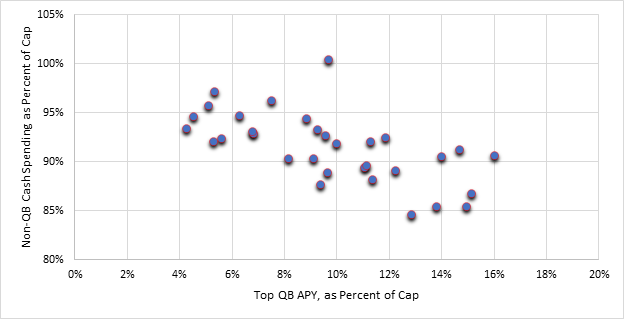
The picture becomes even clearer that we do spend less on the team over the long haul once the big QB is under contract.
So let’s break down every season into tiers based on the QB spending levels to get more of a feel for how the average performance works out here. Here is how the data shakes out.
| Tier | Average Non-QB Payroll of % Of Cap | Average Top QB APY as % of Cap |
| Tier 1 | 89.3% | 15.8% |
| Tier 2 | 88.8% | 12.6% |
| Tier 3 | 92.3% | 7.8% |
| Tier 4 | 95.3% | 2.5% |
As we group the teams we can see a bit more of a trend here with teams with expensive QB’s, on average, spending about 89% of the cap on their non quarterbacks compared to teams with the lowest cost QBs spending about 95%. To put these percentages into more relatable terms a Tier 1 contract would average around $31M and a Tier 2 around $25 million. The Tier 3 and Tier 4 players would be at $15M and $5M respectively. I’d look at those two groups as the lower cost journeymen and higher level draft picks.
With that in mind I would say that if we look at the difference between the Tier 4 and Tier 1 player we can get an idea of how much a team’s roster construction should change based on the QB contract. The 6% difference between the two groups works out to be worth just under $12 million in 2020 terms, so basically the average team is sacrificing a $12 million per year type player once they sign their QB to a lucrative contract.
Now Prescott’s contract is obviously bigger than the Tier 1 average and the cap is about to get weird but if you were to plug his numbers in for a normal year I think you would find that his contract will likely push Dallas to move off about $20 million per year in payroll over the next few years if they consider their payroll relatively sticky. That is not gutting a roster and cutting everyone but it probably does mean a long thought about Michael Gallup vs Amari Cooper at some point or perhaps a different approach where you don’t spend as much as you do on a linebacker and running back.
Still it is basically even footing with all the teams in the NFL who have a $20M+ QB, which is over half the NFL. The disadvantage between Dallas and those teams is far less than the difference between Dallas and a team with a rookie QB, more along the lines of $4 to $8 million a year depending on the QB contract of the other team.
OTC 2021 Free Agency Guide
Welcome to our very first OTC Football Free Agency Guide, a 240 page PDF that not only offers a preview of some of the top free agents in 2021 but an in-depth review of how teams have successfully (and not so successfully) utilized free agency in the past. The book hits on many of the topics that we discuss on OTC or social media outlets when we get into opinions on free agency as well as a unique retroactive look at free agency that is an area not really focused on in the past.
The book is broken down into three sections and includes the following:
Free Agent Outcomes From 2015 to 2019
We look back at how much every team spent on free agents between 2015 and 2019 and how that spending translated into wins in the season of signing. We look at results of offensive and defensive spending based on the team’s prior seasons record to identify some of the biggest spenders in the NFL and what spending levels have brought some success. We further break down spending by position to compare the results based on spending levels and with the control groups who did not spend on a particular position in the offseason.
Individual Positional Outcomes From 2014 to 2020
We go back and look at every UFA who switched teams from 2014 to 2020 to identify contract expectations based on the size and length of a contract. Contracts are grouped in different ways to determine the expected years to be completed on a contract and ultimate contract outcome. We grouped every position into different salary tiers and compared the average various statistical performances in the two years leading up to free agency with how those groups performed in the year they switched teams and, where applicable, in future years.
Free Agent Projections for 2021
Finally, we have profiles of 77 unrestricted free agents that include thoughts on each player, their OTC valuation metric performance over the last two years, a list of five potential comparable players and how they compare statistically with the free agent and the key metrics of those contract to help frame the market of the player. Finally, we arrive at a projection that includes years, average annual value, and guarantee.
If you are a premium subscriber you already have access to the OTC 2021 Football Free Agency Guide and you can download it from the link in the premium menu. If you are interested in becoming a premium subscriber you can read here about some of the features that it includes to get you more depth in evaluating contracts, seeing more data on team construction, or preparing for free agency. If you do subscribe to premium you will be sent a second email with instructions for setting up the account. A few people have had these lost in spam filters and if that happens please let us know via the technical support form and we will get you the necessary link.
If you are not a subscriber you can purchase the guide as a standalone for $24.95.
We hope you enjoy this addition to OTC and we thank you for continuing to make OTC one of your football related destinations every week.