One of the many important responsibilities of an NFL agent includes identifying a list of potential teams for their free agent and undrafted clients. For high end free agents, suitors can be identified through a combination of teams making calls and the agent fielding offers. However, for lower end free agents and undrafted free agents, identifying landing spots can be more challenging and agents must take a more strategic approach in determining which teams would be a good fit for their client. One way is by studying what teams like in terms of body type and a team’s preference towards depth across different positions. A new feature for Overthecap that I have built will serve as a valuable tool in this area.
The first part of this new feature will calculate the average height and weight of players by each position on each team and can be benchmarked against league averages. The chart below is a preview of the new feature.
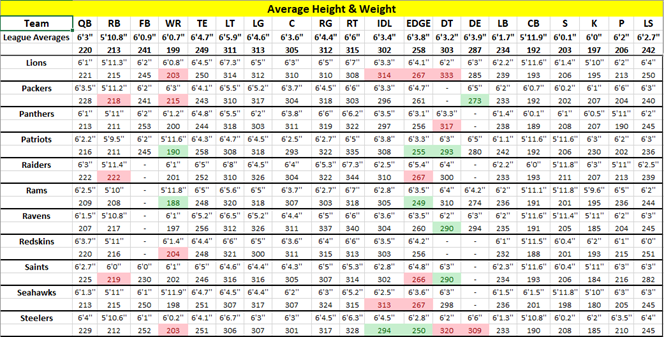
Red cells indicate teams that have the top 20% of heaviest players, on average, at a position. Green cells indicate teams that have the bottom 20% of lightest players at a position. One observation that can be made is that the Packers like heavier WRs. This is consistent with what Head Coach, Matt LeFleur, has said in the past about having big physical WRs who can block. Another conclusion that can be drawn is the Seahawks preference for tall cornerbacks. Although the team’s cornerbacks are not the top 20% tallest in the league, they are still taller than league averages. From an agent’s perspective, if a client is a big-body WR who excelled as a blocker in college or an undrafted cornerback that is over 6 feet, a team like the Packers and Seahawks would be worth calling respectively to gauge their interest. As a supplement to the height & weight chart, I also ran standard deviations on the height and weight of players from each positional group to illustrate the greatest variability in both categories.
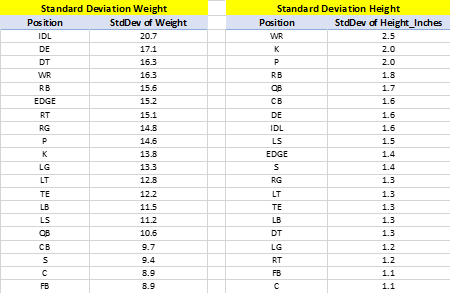
Looking at weight variability, DL is the position with the highest standard deviation. This can be attributed to the size difference between 43 DL and 34 DL. WRs have the greatest variability for height.
The second part of the new OTC feature is a roster count table with a preview shown below.
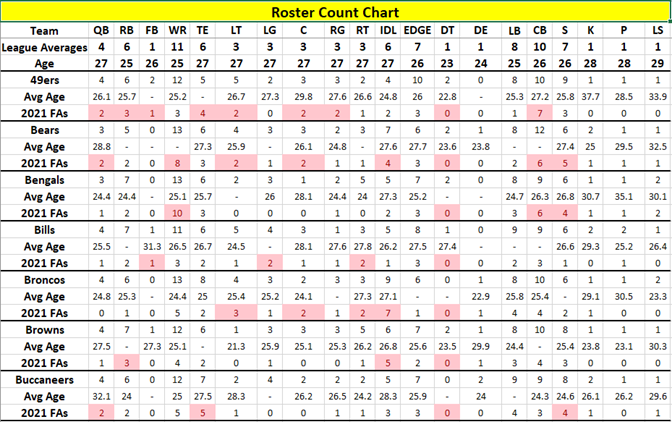
The chart illustrates the number of players on a team by position, average age, and 2021 FAs. One takeaway from the chart is seeing teams that prefer to have more players at certain positions. For example, the Browns currently have 6 TEs on their roster. While these figures are inflated due to off-season rosters, it is still a good indicator for where teams prefer more depth. New Browns’ Head Coach, Kevin Stefanski, had called the most tightend sets when he was Vikings’ Offensive Coordinator last year. Early indications show he will continue that theme in Cleveland and another example of how agents can leverage this information when identifying potential fits for their UDFA or low-tier SFA clients. The chart also illustrates average age by position and number of 2021 FAs which is especially useful when determining where a team may have a need in the future. While this new tool is certainly not a be all end all, it is a good starting point when determining which teams to reach out to on behalf of UDFA and low tier SFA clients.