As we move into the NFL preseason I wanted to take a closer look at spending in the NFL this year. Today I am going to look at the offense and see how teams are spending their money on each position. The numbers are based on the new money average per year of the top 30 players on offense.
Overall Spending on Offense
The average team has $121 million per year committed to the top 30 players on offense. The Browns lead the way, by far, in value placed on the offense- their contracts average $170 million per year. The Cardinals, Raiders, and Buccaneers are all closely grouped around $155 million each. The Panthers round out the top 5 at $146 million, though you can argue what the value of Baker Mayfield should be in this situation.
The teams with hardly any investment on offense are the Bears (A paltry $57.6 million), Steelers ($72.4 million), Falcons ($82.1 million), Bengals ($82.8 million), and Giants ($93.1 million). The Bengals number is in part low because they have key players obtained in the draft. The others are just sorting through things.
QL Spending
The Eagles lead the way with $65.7 million per year invested in their offensive line. That is nearly $15 million a year more than the Browns at $51.7 million. The Panthers, Lions, and Ravens are all around $50 million. The Patriots have the least invested with just $22.8 million spend on the offensive line. Seattle, who seemingly never spend on the line, is at $26 million while the Bears are the other team under $30 million at $27 million per year. The NFL average is $40.5 million.
WR Spending
With the recent swings in salary at receiver I was curious to see how this would play out. The current average per team is $31.5 million, which is about what Miami spends on Tyreek Hill (yes I know the number is inflated but its used in the calculations). Tampa Bay is up to $57 million on the year followed by Miami at $50 million, the Rams at $49 million and the Seahawks and Raiders at $48 million. The disparity at this position is huge with a $51.4 million per year gap between the top and bottom team, by far the most of any position other than QB. The Ravens spend just $5.3 million here followed by the Steelers at $10.4 million, the Colts at $11.2 million, and the Bears at $13 million.
RB Spending
Running back spend averages under $11 million a season and just two teams have over $20 million committed to the position- the Browns and the Saints. The Vikings and Panthers are both at $19 million while the Titans round out the top 5. The teams not wasting resources at this position are the Bears, Rams, and Eagles (all under $5 million), and Commanders ($5.5 million).
TE Spending
While the Patriots don’t have much invested in their offensive line they sure do have money invested at tight end with $27 million in contracts. They are the only team in the NFL that spends more on tight ends than they do on their offensive line. The Ravens have $22 million here as they are the lone team to spend more on tight ends than receivers. Miami is the other team over $20 million. The 49ers and Eagles round out the top 5. The Giants, Steelers, Bills, and Vikings are not even spending $4 million on the position.
QB vs non-QB Spending
I thought it might be interesting to see how much teams are spending on their offense relative to their spending on QB rather than looking at QB spending which is generally just dependent on one player. The following graph breaks it down.
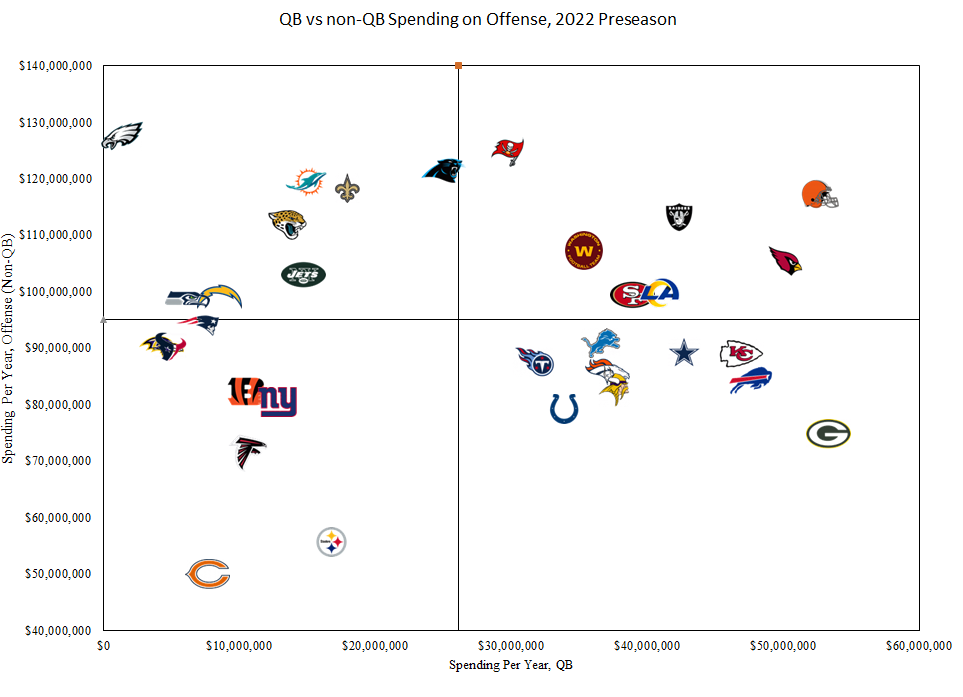
Teams in the top right quadrant are the ones heavily invested in the offense. These are the teams with the expensive QB’s who are still committed to trying to invest in as many parts as possible around the QB. The Browns would be the primary standout here.
The bottom right identifies the teams with an expensive QB situation who have decided to maybe cut some corners elsewhere. The Packers would be a team with a giant gap as they have a fortune invested in Aaron Rodgers while ranking 29th in spending on the rest of the offense.
The top left are primarily teams with rookie QBs or questionable QB situations who are going out and spending on the offense. For Jalen Hurts this is clearly a big year for him and the Eagles. He has a ton of talent to work with and will be extension eligible after the season. The same can probably be said for Miami.
The bottom left quadrant are teams with low cost rookies/bad QB situations who are either heavily reliant on draft pick contribution or just punting on the offense this year. The Giants and Falcons on paper are the two worst situations while the Steelers and Bears are giving their young QB’s almost no help.
The following table has the spending breakdowns for each team. It should be sortable if you click on the header.
| Team | OL | QB | RB | TE | WR | Non QB | Overall |
| Browns | $51,671,979 | $52,802,500 | $22,287,323 | $14,703,508 | $28,627,389 | $117,290,199 | $170,092,699 |
| Cardinals | $42,117,090 | $50,257,500 | $9,145,147 | $15,619,910 | $38,502,867 | $105,385,014 | $155,642,514 |
| Raiders | $38,552,960 | $42,474,160 | $16,606,795 | $9,657,501 | $48,316,000 | $113,133,256 | $155,607,416 |
| Buccaneers | $48,118,735 | $29,828,834 | $11,852,110 | $8,071,488 | $56,684,330 | $124,726,663 | $154,555,497 |
| Panthers | $50,765,118 | $25,088,486 | $19,064,143 | $7,776,609 | $43,602,642 | $121,208,512 | $146,296,998 |
| Commanders | $44,973,596 | $35,380,400 | $5,504,386 | $10,071,991 | $46,823,089 | $107,373,062 | $142,753,462 |
| Rams | $34,763,242 | $40,895,000 | $4,485,921 | $11,805,202 | $48,741,924 | $99,796,289 | $140,691,289 |
| 49ers | $35,828,234 | $38,960,568 | $10,791,264 | $18,290,000 | $34,319,064 | $99,228,562 | $138,189,130 |
| Saints | $48,338,220 | $18,038,395 | $20,152,500 | $14,709,470 | $35,088,968 | $118,289,158 | $136,327,553 |
| Chiefs | $42,780,183 | $47,000,000 | $9,311,338 | $16,533,445 | $20,196,390 | $88,821,356 | $135,821,356 |
| Dolphins | $34,365,831 | $15,004,411 | $14,336,555 | $20,698,174 | $49,980,247 | $119,380,807 | $134,385,218 |
| Cowboys | $36,952,207 | $42,823,249 | $17,676,667 | $14,068,053 | $20,448,139 | $89,145,066 | $131,968,315 |
| Bills | $41,188,501 | $47,645,000 | $6,108,036 | $3,500,000 | $33,268,516 | $84,065,053 | $131,710,053 |
| Eagles | $65,722,677 | $1,506,294 | $4,903,939 | $17,223,535 | $39,697,822 | $127,547,973 | $129,054,267 |
| Packers | $33,824,964 | $53,367,535 | $14,211,224 | $10,587,421 | $16,123,965 | $74,747,574 | $128,115,109 |
| Lions | $50,308,630 | $36,650,000 | $9,926,811 | $6,895,946 | $23,724,919 | $90,856,306 | $127,506,306 |
| Jaguars | $47,321,784 | $13,558,372 | $6,023,595 | $17,179,505 | $41,146,517 | $111,671,401 | $125,229,773 |
| Broncos | $38,633,324 | $37,185,000 | $7,523,939 | $6,198,296 | $33,366,071 | $85,721,630 | $122,906,630 |
| Vikings | $37,196,594 | $37,578,353 | $19,374,038 | $3,598,844 | $22,976,153 | $83,145,629 | $120,723,982 |
| Titans | $33,939,865 | $31,685,025 | $18,483,052 | $10,541,084 | $24,503,569 | $87,467,570 | $119,152,595 |
| Jets | $49,801,861 | $14,827,695 | $6,730,618 | $16,011,226 | $30,377,032 | $102,920,737 | $117,748,432 |
| Colts | $47,723,319 | $34,002,676 | $11,012,289 | $9,199,260 | $11,186,739 | $79,121,607 | $113,124,283 |
| Chargers | $33,041,603 | $8,644,689 | $10,947,101 | $8,931,641 | $46,011,347 | $98,931,692 | $107,576,381 |
| Seahawks | $25,787,684 | $6,259,521 | $11,927,745 | $12,139,041 | $48,496,784 | $98,351,254 | $104,610,775 |
| Patriots | $22,749,160 | $6,973,353 | $8,323,994 | $27,195,271 | $35,503,632 | $93,772,057 | $100,745,410 |
| Texans | $44,650,688 | $4,993,025 | $9,812,608 | $7,354,037 | $28,357,776 | $90,175,109 | $95,168,134 |
| Ravens | $50,088,278 | $4,382,913 | $12,576,514 | $22,070,015 | $5,308,120 | $90,042,927 | $94,425,840 |
| Giants | $35,929,994 | $12,861,014 | $11,485,906 | $3,385,778 | $29,496,169 | $80,297,847 | $93,158,861 |
| Bengals | $34,502,232 | $10,547,534 | $15,470,722 | $5,732,407 | $26,590,941 | $82,296,302 | $92,843,836 |
| Falcons | $33,617,571 | $10,715,741 | $10,321,805 | $10,363,127 | $17,075,946 | $71,378,449 | $82,094,190 |
| Steelers | $32,350,202 | $16,852,163 | $9,409,552 | $3,425,851 | $10,377,263 | $55,562,868 | $72,415,031 |
| Bears | $27,517,484 | $7,752,988 | $4,034,759 | $5,264,447 | $13,036,068 | $49,852,758 | $57,605,746 |
| NFL. Avg | $40,472,619 | $26,141,950 | $11,556,950 | $11,525,065 | $31,498,637 | $95,053,271 | $121,195,221 |