Every week or every other week I usually post a graph on Twitter which shows how a team is performing on offense and defense relative to their schedule. Since I often get a number of questions about them I figured I may as well throw them up in a post as well.
On offense a teams scoring efficiency tells you how much a team is scoring per game compared to how much their opponents allow per game in games where they don’t face you. This can sometimes show that a team scoring a ton of points but against a cupcake schedule may not be as great as you think and has taken advantage of a schedule. So for example the top scoring team is actually the Raiders at 27.4% above their schedules average. The worst unit, not surprisingly, is the Jets at -46.1%. These are not adjusted to take out defensive scores and special teams scores so the numbers can also be impacted by this (this also goes for defense).
On the defensive side we measure what percent below the average a team holds a team. When I posted this the other week a few people were caught off guard when I didn’t say Seattle’s defense was bad (they were right on the average line), but the fact is while Seattle gives up a ton of points the offenses they had played scored a ton of points on everyone. The best team has been the Ravens on this side holding teams to 31.4% below their average. The Cowboys are in a class all by themselves on defense allowing teams to score 51.6% over their average. Its an absurd number.
Plotted as a graph what we see is the following
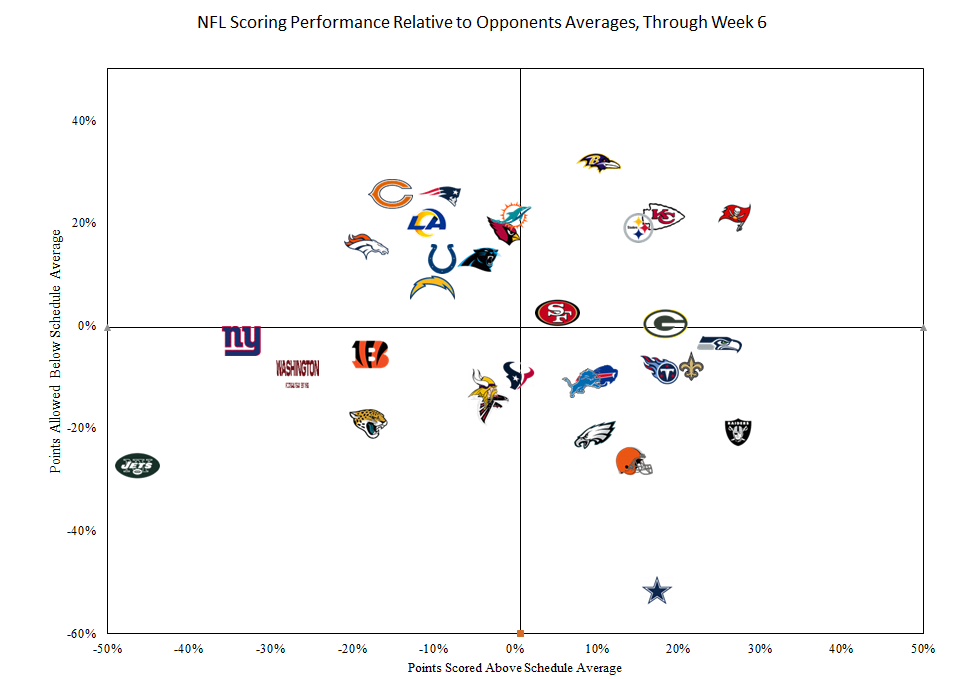
Teams in the upper right have a good offense and defense. These are generally the best teams in the NFL and have the best chance at the playoffs minus bad luck/injuries.
Teams in the bottom right have a good offense and bad defense. These teams usually compete for the playoffs as offense is usually more important (some teams that are garbage point teams are usually an exception).
Teams in the top left have a good defense and bad offense. These teams I think are less likely to compete than those with the good offense/bad defense combo, usually requiring a bit more of an easy schedule for 16 games with some luck to advance.
The bottom left teams just stink. These are the teams mainly looking for draft picks not playoff spots.
Here is the data in table form. The total efficiency is the just the adding of the offense and defense while the predicted wins is a model based on past results. I probably should update those as its based on much more historical data and the NFL has changed a lot in that time so I really need to retest those.
| Team | Points Scored | Points Allowed | Total Efficiency | Projected Wins |
| Buccaneers | 27.0% | 21.0% | 48.0% | 12.5 |
| Ravens | 10.4% | 31.4% | 41.8% | 12.0 |
| Chiefs | 18.2% | 21.1% | 39.3% | 11.7 |
| Steelers | 15.2% | 19.0% | 34.2% | 11.2 |
| Seahawks | 25.2% | -3.8% | 21.3% | 10.0 |
| Dolphins | -0.3% | 21.2% | 20.9% | 10.0 |
| Packers | 18.5% | 0.2% | 18.7% | 9.7 |
| Cardinals | -1.3% | 18.4% | 17.0% | 9.6 |
| Patriots | -9.2% | 25.0% | 15.8% | 9.5 |
| Saints | 21.7% | -8.1% | 13.6% | 9.3 |
| Bears | -15.1% | 25.4% | 10.3% | 9.0 |
| Rams | -10.9% | 20.1% | 9.2% | 8.9 |
| Titans | 17.7% | -8.8% | 8.9% | 8.8 |
| Panthers | -4.3% | 12.6% | 8.3% | 8.8 |
| 49ers | 5.3% | 2.3% | 7.5% | 8.7 |
| Raiders | 27.4% | -20.8% | 6.7% | 8.6 |
| Colts | -8.8% | 12.9% | 4.1% | 8.4 |
| Bills | 10.1% | -10.6% | -0.4% | 7.9 |
| Chargers | -10.1% | 7.3% | -2.8% | 7.7 |
| Broncos | -18.1% | 15.2% | -2.8% | 7.8 |
| Lions | 8.3% | -11.3% | -3.0% | 7.7 |
| Texans | 0.5% | -10.0% | -9.5% | 7.1 |
| Eagles | 9.9% | -21.4% | -11.4% | 6.9 |
| Browns | 14.7% | -26.4% | -11.7% | 6.8 |
| Vikings | -3.9% | -12.5% | -16.4% | 6.4 |
| Falcons | -3.0% | -15.9% | -18.8% | 6.2 |
| Bengals | -17.7% | -5.7% | -23.4% | 5.8 |
| Cowboys | 17.6% | -51.6% | -34.0% | 4.7 |
| Football Team | -26.6% | -9.5% | -36.1% | 4.6 |
| Giants | -33.4% | -3.0% | -36.4% | 4.6 |
| Jaguars | -18.0% | -19.3% | -37.3% | 4.5 |
| Jets | -46.1% | -27.4% | -73.5% | 1.0 |
Add OTC to Your Google News Feed to stay up to date with our updates