Here are the notes for the NFC Championship to go along with the AFC Championship notes that you can find here. As I said there, these are just some initial notes looking at their caps and more thorough analysis will be coming on this week’s podcast, which will be coming tomorrow or Friday.
Here are some of the important stats that I put together for the 21 Super Bowl champions as well.
As always, e-mail me at Caponomics@gmail.com as well if you have any questions or want to join the e-mail list for Caponomics, which is in the process of being edited now.
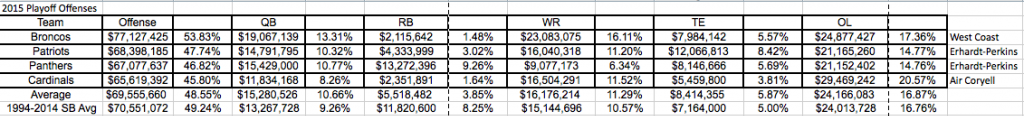
Offensive Positional Spending
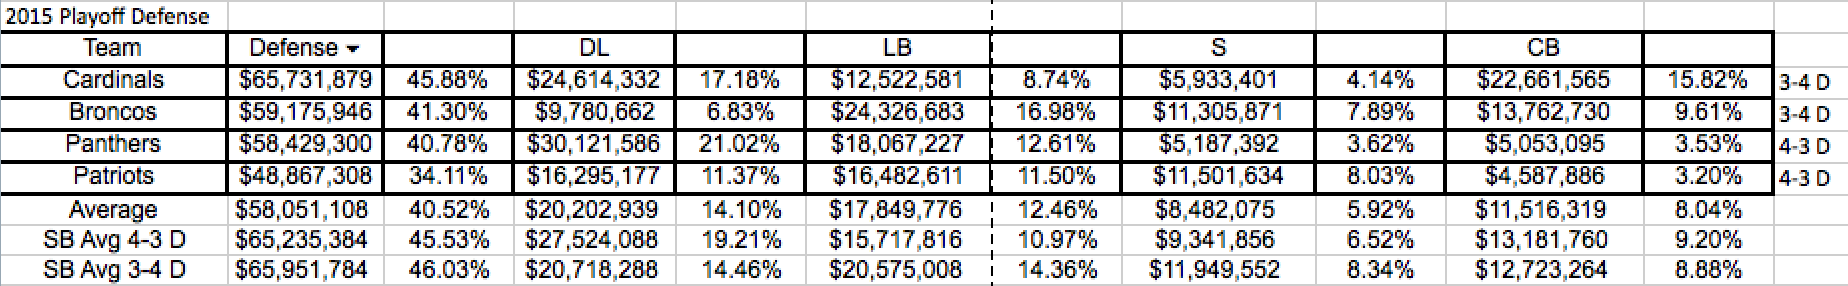
Defensive Positional Spending
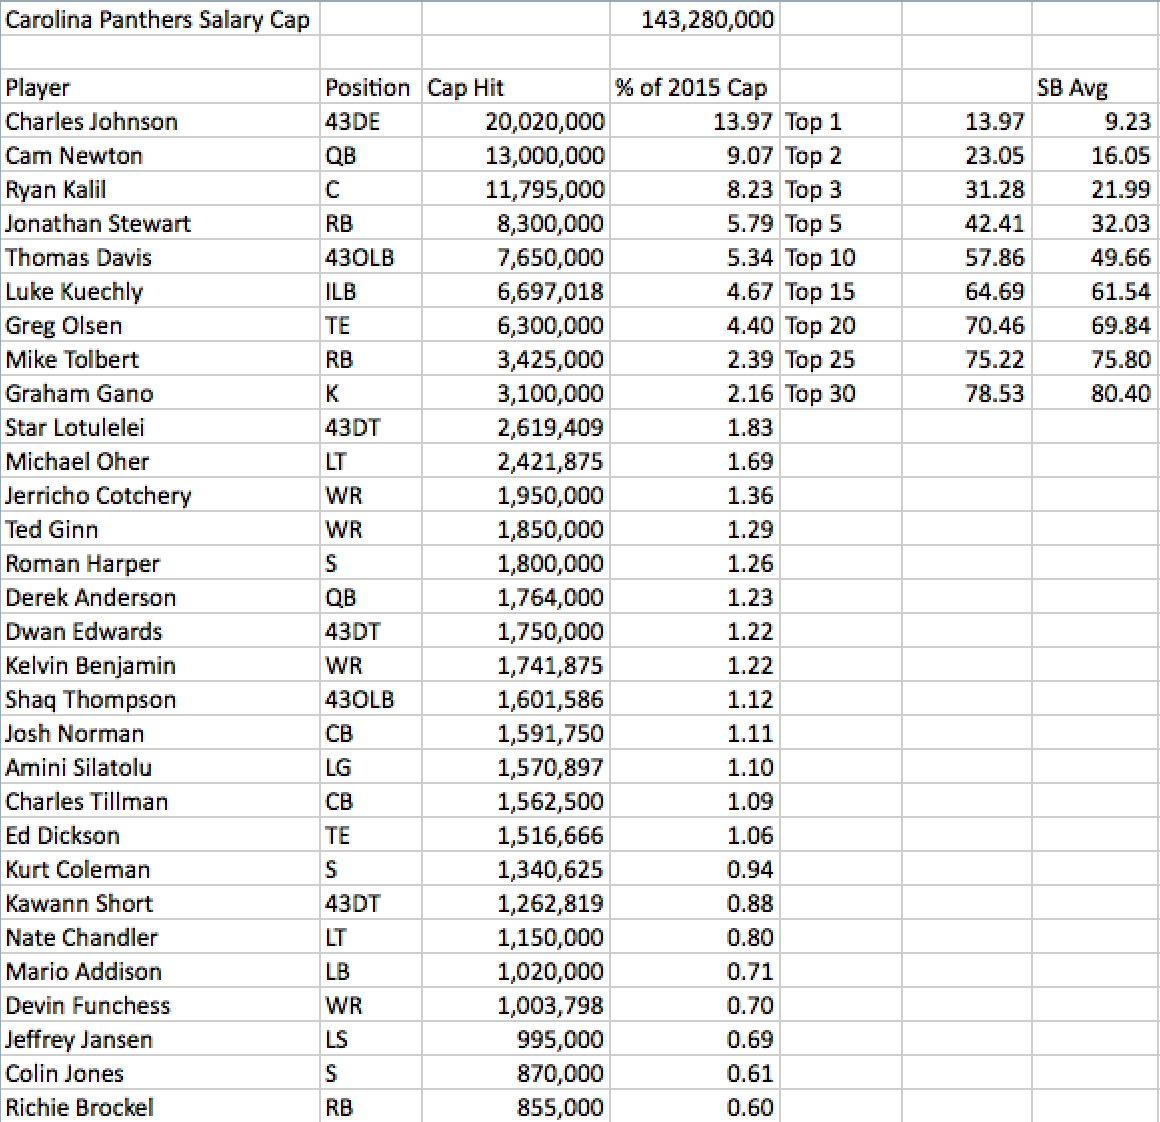
Panthers Top 30
Cardinals Top 30

Carolina Panthers
- The Panthers have been constructed to follow the model of the kinds of teams that Coach Ron Rivera played on as a Chicago Bear from 1984 through 1992 with the strong defense and running game. More recently, the 2000 Ravens and 2013 Seahawks were the best example of the run-first/defensive model with the Seahawks being the team that the Panthers themselves have stated show them that their strategy can win a Super Bowl. I say this often, but in an era where seemingly any quarterback could go off for a 300-yard game due to the talents of QBs and their pass catchers, the rules, and the systems they play in, there’s an efficiency that’s created through run/pass balance that can’t be overlooked. Seattle and Carolina have done a terrific job creating this with mobile quarterbacks who make the game 11-on-11 football; the Chiefs have done this as well with Alex Smith.
- Charles Johnson’s contract is a holdover from the previous regime and at 13.97% of the cap, it’s far higher than you would want for any player on your team, especially a non-quarterback. As Jason wrote the other day, the Panthers should release him or re-work his contract as he will cost 9.75% of the projected cap, while his dead money would only cost 2.61%. While Johnson is a solid player, there are almost no non-quarterbacks in the league who are worth 10% of the cap and he isn’t either.
- Having Cam Newton at 9.07% is very valuable for this team and he’s right in the middle of the pack as his cap hit is outpaced by eight Super Bowl Champion QBs: Steve Young (13.08%), Brett Favre (10.25%), Drew Bledsoe (10.29%), Brad Johnson (9.57%), Peyton Manning (10.36%), Eli Manning (9.22%/11.75%) and Tom Brady in 2014 (11.13%). Newton is slightly above the average for Super Bowl quarterbacks at 7.63% of the cap and with that cap number, he and the Panthers remind me a little bit of the 2002 Bucs construction with Newton having a similar cap hit to Johnson and then a construction on defense that centers around an expensive 4-3 defensive line. In 2015, Newton had 3837 passing yards and a 59.7% completion percentage with 35 touchdown passes to only 10 interceptions, plus 636 rushing yards at 4.8 per carry in a zone read offense that’s efficiency led to a yard per play average of 5.53. Their defense gave up 4.88 yards per play, which leads to a nice difference in yards per play of +0.65 for the Panthers, just in line with the average for the 21 champs of the cap era of 0.64.
- If the Panthers win the Super Bowl with a Top 3 consisting of Johnson (13.97%), Newton (9.07%) and center Ryan Kalil at 8.23%, their 31.28% Top 3 charge will break the Top 3 record of 27.83%, which was set by the 2002 Bucs at 27.83%. The Bucs took the cake for the highest Top 5 charge as well at 38.36%, but the Panthers would pass them up there as well with their 42.41% Top 5.
- The Bucs Top 5 had Warren Sapp, Brad Johnson, Simeon Rice, Derrick Brooks and Jeff Christy. The Panthers Top 5 has Charles Johnson, Cam Newton, Ryan Kalil, Jonathan Stewart and Thomas Davis.
- Obviously some similarities between these two groups. Both have defensive linemen as their top cap hits, quarterbacks as their number two, plus a center and a 4-3 OLB in their Top 5. Where the Panthers had two defensive linemen in their Top 5, the Panthers only have one and have a running back instead. The 2002 Bucs had Mike Alstott as their ninth highest cap hit, but their top RB hit was Michael Pittman as their 19th at only 1.23% of the cap. While I’ve been against the high spending at running back, it’s kind of a missing piece in a direct comparison between the two teams as they both have stellar defenses, but the Bucs had an offense that ranked 18th in points scored, 24th in yards, 15th in passing yards and 27th in rushing yards. The Panthers are actually ranked 24th in passing yards, but has nine more yards per game than the Bucs did. The Bucs were also one of only two teams with the 2011 Giants to average less than 100 rushing yards per game. The Panthers averaged 142.6 rush yards per game with Newton and Stewart and that’s only outpaced by the 1997 and 1998 Broncos who averaged 148.6 and 154.3 rush yards per game.
- A huge part of the Panthers strategy is to have a big, strong team under the guidance of their strength and conditioning coach Joe Kenn. This is really well reflected in their offensive skill players as they have a nice assortment of players who do different things, create different mismatches. Something that continues to come up is the importance of mismatches, which Chris B. Brown is always talking about at Smart Football, but also something that I find an exciting lesson from watching the UFC as you’ll see the way a fighter will exploit an advantage they have over the other fighter, a mismatch, all fight. Using that analogy, the Panthers are heavyweights. One of the main goals of any offense is to get your playmakers in one-on-one situations where you’re forcing defenders to tackle your guys by themselves. With many in the league moving toward quick or faster guys, the Panthers take the big guy approach and I feel that it’s an approach that wears the defense out.
- Jonathan Stewart, 5’11”, 235:
- There simply aren’t many humans built like this who move like this at that size.
- At 5.79% of the cap, Stewart is expensive, especially for this era as the other three teams combine to spend 6.14% of their 300% of potential cap space on their running backs, but he is certainly worth it for this team. A similar comparison would be Marshawn Lynch consuming 6.91% of the 2013 Seahawks salary cap. The average top running back for champs costs 3.85%.
- Cameron Artis-Payne is 5’10”, 212-pounds and has a similar physical running style, so although he’ll be 26-years old before the start of his second year in 2016, he’s a solid style to back up Stewart.
- Mike Tolbert, 5’9”, 243
- He reminds me a lot of Jerome Bettis, but more of a bowling ball heading down hill without the same finesse as Bettis. Looking at the Cardinals use of Deone Bucannon at linebacker (6’1”, 211), we see a team that’s responded to league’s offenses and gone smaller with a guy who they hope can cover TEs and slot receivers, while defending the run. It’s similar to something I saw while I was staying down in Texas and watching Big 12 games as every weekend I’d see these spread offenses and the defenses response. Each team had their own creative response to the spread and the smaller OLB is one that is popular. The lesson I learn from Belichick so often: know the trends and exploit them.
- At 2.39% of the cap, Tolbert is a little pricey for a guy who only played 38.3% of his team’s snaps, but he was named to the All-Pro team as a FB and gives them a serviceable RB in a pinch, while also adding to their run/pass blocking and additional production.
- Greg Olsen, 6’6”, 254
- Using a tight end of Olsen’s caliber as the centerpiece of this passing game is a huge money saver as he may be the most valuable non-quarterback left and he only cost the Panthers 4.40% of the cap, while the receivers like D. Thomas and Larry Fitzgerald cost at least 3% of the cap more. He’s less expensive than Gronk too at 6.05% of the cap. There’s no point of having a discussion on who is the most valuable non-QB left, but in regards to the passing game, it’s hard to distinguish who could be more valuable to their team than Olsen. Throw Edelman in with Olsen, Thomas, Fitzgerald and Gronk and all five are team MVP candidates.
- Ted Ginn, 5’11”, 178
- Ginn is their “field stretcher,” their deep threat, the guy who opens up the field for the rest of the offense. At the 2007 combine, Ginn ran a 4.28 forty and his two seasons with the Panthers have resulted in his two highest yard per reception totals in his career. In 2013, he had 36 catches for 556 yards (15.4 ypc) and 5 touchdowns and this year he had 44 for 739 (16.8 ypc) and 10 touchdowns. Over the course of the rest of his career, he has a grand total of six touchdowns, which is an example of the way the Panthers seem to maximize his talent.
- Jerricho Cotchery 6’1”, 200
- Watching him play against the Seahawks, I’m always shocked at how stocky Cotchery is. He’s never been the kind of player who will blow you away with his production, but he’s been a nice replacement for Steve Smith at only 1.36% of the cap.
- Devin Funchess, 6’5”, 230
- I was surprised with the Panthers drafted him in the second round as there was a conversation about whether or not the guy was a tight end or a receiver and he ran a 4.70 forty, which can still scare teams off, even at his size. What I didn’t realize was why the Panthers drafted him, at least not until this season when I saw the Panthers strategy in action. With his 38.5 vertical jump and his 6’5” stature, Funchess is a phenomenal redzone target. In this year, his rookie year, he had 31 catches for 473 yards (15.3 ypc) and five touchdowns. His size is similar to Benjamin’s and he ran a 4.61 at the combine, so they must’ve seen something in both players that fit their system. Funchess will be a nice supplement to Benjamin long-term, but he’s also a nice replacement when Benjamin is down and having players who can fill a role well if a star goes down is something that I think is very important. The Panthers didn’t skip a beat without Benjamin thanks to their 2015 second round pick and Ted Ginn too.
- Kevin Benjamin, 6’5”, 240
- In 2014, Benjamin had 73 catches for 1008 yards (13.8 ypc) and nine touchdowns. His yardage total tied Olsen to lead the team. In 2014, Newton and Derek Anderson threw for a combined 23 touchdowns, so adding Olsen’s six to Benjamin’s nine, Corey Brown had two, then six guys with one. While Benjamin’s injury was certainly a loss, as I said above, the Panthers found ways to fill that void.
- Corey Brown, 6’, 190
- His draft profile states that he ran a 4.51 and his strengths in that profile say that he’s able to work himself open on short-to-intermediate routes and that he has the quickness to elude a tackler and pick up YAC. They also note that he has lined up inside and outside, which is a nice skill to have. They must have seen something in him that others didn’t because even at Ohio State, after a 60 catch for 669-yard season in 2012, both of which led the team, Urban Meyer moved him to DB for the 2013 season. His story would definitely be an interesting one to get into to understand why he was moved to DB, why he was moved back, what the Panthers saw in him, etc.
- As I explained earlier, the Panthers have many cap similarities to that Bucs team. In my opinion, the best place to start a cap conversation is at the quarterback position. Brad Johnson was nowhere close to the talent of Cam Newton, but Johnson’s 9.57% cap hit and the construction of the defense around him is an example for teams now. Look at the Patriots with Brady at 9.77% of the cap and the Manning/Brady article that I reference so often and you see how a cap hit in the neighborhood of 9-10% can ensure that a top tier quarterback gets paid, while providing the team with an opportunity to build a complete team around that quarterback. With that said, Charles Johnson’s huge cap hit is most certainly an issue as 13.97% of the cap is out of hand for any player, but general manager Dave Gettleman was the Giants Pro Personnel Director from 1999 through 2011, so he knows something about finding defensive line talent and was able to fill the rest of the line with players who have outperformed their low-cost contracts and thus their defensive line spending only ends up being 21.02% of the cap, which isn’t much higher than the 19.21% average for 4-3 Super Bowl champion defenses. While I’m firmly against paying a defensive end that much money, the Panthers did a solid job building around the previous regime’s last existing mistake.
- Getting to that defensive line, DT Star Lotulelei is their second highest cost player there at 1.83% and fellow DT Dwan Edwards costs 1.22%. Past that, there are a few guys under 1% of the cap making a real difference for the team in veteran Jared Allen (0.57%), plus young guns Kony Ealy (0.56%) and Kawaan Short (0.88%). According to Pro Football Focus, Short was the fourth best defensive tackle in the NFL this season with a rating of 45.4, which is actually higher than Aaron Donald’s rating of 37.1 during his Defensive Rookie of the Year season in 2014. As I mentioned before, I think that Gettleman has proven he has an eye for talent on the defensive line and the Panthers salary cap will likely reflect this moving forward as they won’t overpay like the Panthers of years past did with Johnson.
- Thomas Davis at 5.34% of the cap with Luke Kuechly at 4.67% for a total of 10.01%, which would make it the most for a 4-3 linebacking duo since the 2001 Patriots with Willie McGinest and Ted Johnson costing 12.37% and Ray Lewis and Peter Boulware combined for 9.84% of the cap for the 2000 Ravens. By 2012, the Ravens had converted to a 3-4 defensive scheme with Terrell Sugs and Ray Lewis combining to cost 15.23% of their salary cap and, while this is less applicable to the Panthers linebackers as the 3-4 alignment causes for spending differences, Suggs’ 9.55% cap hit is the height of pass rusher spending, which is a bit closer to Johnson’s 13.97% cap hit than Reggie White’s record 8.90%. For 10.01% of the cap, the Panthers got two linebackers and the market seems to only get as high as about 6% of the cap, while positions like cornerback and defensive end see their markets skyrocket. To that point, Rivera knew he was trying to recreate the old Bears teams, so they’d clearly need great linebackers, and with the league where it is right now, that market hasn’t seen the price increases. Like with the Seahawks in 2013, the Panthers are able to take advantage of the lower costs at the old school positions like linebacker and running back to get guys who are at the top of their market, but not at a crazy price.
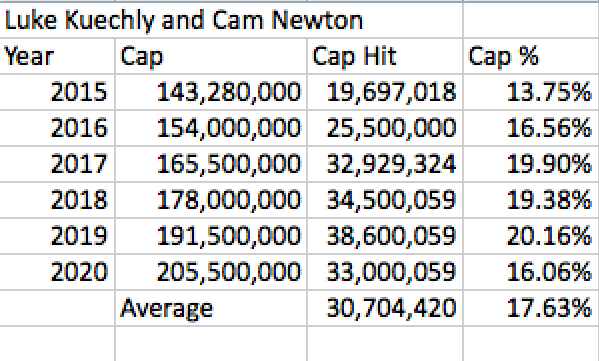
- So over six years, the Panthers will have Kuechly and Newton at an average of 17.63% of the cap, which is very reasonable for perennial offensive and defensive player of the year candidates.
- Jonathan Stewart, 5’11”, 235:
- The Bucs Top 5 had Warren Sapp, Brad Johnson, Simeon Rice, Derrick Brooks and Jeff Christy. The Panthers Top 5 has Charles Johnson, Cam Newton, Ryan Kalil, Jonathan Stewart and Thomas Davis.
Arizona Cardinals
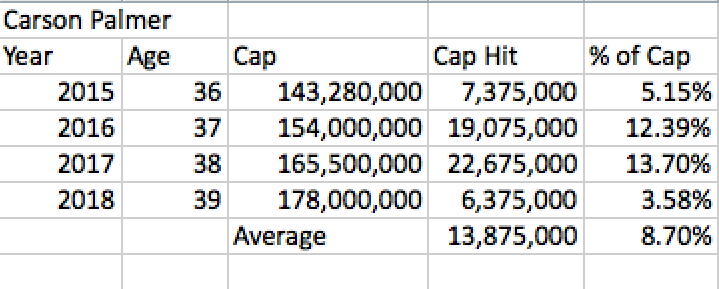
- The Cardinals have interested me all season with the performance they were getting an MVP performance out of Carson Palmer for only 5.15% of the cap, which is even below the 7.63% average of Super Bowl QBs. With their Air Coryell offense, it reminds me a bit of the value that the 1995 Cowboys got out of Troy Aikman at 6.72% and the 2012 Ravens got out of Joe Flacco at 6.63%. In the net two seasons, Palmer’s cap hit will get up in between 12-14% of the cap, but the Cardinals may be able to offset this slightly with a running back group that’s highly productive, but very low cost considering Andre Ellington and David Johnson are on their rookie deals and they’ll probably get another year or two out of Chris Johnson at a low-price as he’ll probably stick around as he knows he can succeed in Arizona. Conversations about Arizona’s future are for another day though.
- Considering that the Cardinals are an Air Coryell offense, which means they need a strong offensive line to protect on five and seven step drops, they’ve correctly invested heavily in the OL at 20.57% of the cap on the group, 3.81% above the Super Bowl average. They have three linemen in their Top 10 in LT Jared Veldheer, LG Mike Iupati and LG Jonathan Cooper and nine linemen in their Top 30 charges. Their starting OL costs 15.81% of the cap, which would be fifth behind the 2013 Seahawks at 18.59%, 2005 Steelers (16.44%), 2006 Colts (16.25%), and 1994 49ers (15.84%). Having linemen taking up almost a third of their Top 30 cap hits is a sign of the importance that the Cardinals place on their Air Coryell OL, which is a very good move as they’ve found a way to get a deep group of talent in case of injuries or ineffectiveness.
- Similar to the Air Coryell point, they spent 2.70% of the cap on back-up QB Drew Stanton, which is very important as the Cowboys see every time Romo goes down. (In the Cowboys defense, Brandon Weeden seemed like a solid back-up plan to me.) In a league where concussions become a bigger issue with players missing a week or two at a time, and just all the quarterback injuries this year, the back-up quarterback market is going to increase.
- Their running backs were one of the best positional values in the league as the Cardinals were the eighth in the league with 119.8 rushing yards per game at only 1.64% of the cap. They saw last season that the ideal situation would be a backfield with three real options after seeing the struggles of last year and the realization that Andre Ellington’s injury history was a major risk. Like I mentioned before, their running back situation is pretty well set for the near future, especially considering how good Kerwynn Williams has looked this year at 5.3 yards per carry.
- Their wide receiver group is a very valuable even at their high 11.52% price tag because they have every kind of mismatch, plus a tight end group that only costs 3.81% of the cap and gets the job done as Fells and Gresham combined for 534 receiving yards. If the 2008 Cardinals won the Super Bowl, they probably would have been the worst in NFL history with a defense that gave up 26.6 points per game, which would have been higher than the 2011 Giants who had the worst Super Bowl defense at 25.0 per game. Their offense was last in the league in rushing at only 73.6 yards per game, but they had Kurt Warner throwing to three thousand yard receivers in Larry Fitgerald, Anquan Boldin and Steve Breaston. That Cardinals team was second in the NFL in passing yards in 2008, just like they were in 2015.
In 2015, their top three receivers are Fitzgerald with 1215 yards, John Brown with 1003 and Michael Floyd with 849. While their offense and quarterback changed, Eric Decker was a different player this season with Brandon Marshall giving the Jets another viable option; Randall Cobb without Jordy Nelson showed us that situation in reverse as Cobb’s production dropped from 91/1287/12 to 79/829/6. Especially in a division where you have to play Richard Sherman twice a year in massive divisional match-ups, you need more than one great receiver and to take that point further, John Brown (5’11”, 179) is in the same mold as Antonio Brown (5’10”, 181) and Antonio has had a ton of success against cornerbacks of all sizes due to his quickness and route running. Bruce Arians’ last year as the Steelers OC was Antonio’s breakout year with 69 catches for 1108 yards (16.1 ypc) and two touchdowns and, having been a wide receivers coach with the Steelers from 2004 to 2006 as well, he understands the workings behind what’s arguably been the most well-drafted positional group of the last ten years as they’ve cycled through countless mid- to late-round draft pick playmakers.
Having Floyd on the last year of his rookie deal at 2.21% of the cap and Fitzgerald on a re-worked contract that put him at 7.57%, they have two veteran receivers at 9.78% of the cap, which is barely higher than Demaryius Thomas at 9.21%, so a pretty good value in today’s market.
- Moving to the defense they have Peterson and Campbell as their Top 2 cap hits at 20.62% of the cap, which would be just a tick below the Young/Rice record of 21.64%. While I don’t like investing that much in two guys, especially two defensive guys, they’re two of the five best players in the NFL at their respective positions, so it’s a sound investment. Their Top 5 is a bit similar to the 2012 Ravens with Suggs, Ngata, Reed, Flacco and Boldin combining for 38.10% with the only difference in positions being the Cardinals having a left tackle, rather than a defensive tackle and a cornerback instead of a safety. Considering the various ways money can be spent, and considering that the average Top 5 for a Super Bowl champion is about a third of the salary cap, the Top 5 might be a good place to start basing some spending theories in. It’s also just enough players to kind of have an idea of what the team is trying to accomplish.
Example, when you look at the 2006 Colts and see Peyton Manning, Tarik Glenn (OL), Dwight Freeney, then Marvin Harrison and Reggie Wayne to round out that Top 5, you realize you’re looking at a team that is going to try to win throwing the ball. Looking at the 2000 Ravens Top 5 of Jonathan Ogden, Ray Lewis, Michael McCrary (DE), Rod Woodson and Peter Boulware, you realize why they were one of the best defenses of all-time and easily understand their approach. Could be an important lesson to make things easier moving forward.
- The Cardinals had the best yard per play difference of all the playoff teams this year at 1.04 with 6.28 offensive yards per play and 5.24 defensive yards per play, a terrific sign of their team’s balance. If the Cardinals win the Super Bowl, only the 1999 Rams (1.71) and the 2013 Seahawks (1.15) will have a bigger yard per play difference. That Rams team was referred to as The Greatest Show on Turf for their high flying offense, but the Cardinals actually averaged more yards per game this season with 408.3 compared to the Rams 400.8. The Cardinals and that Rams team had defenses ranked in the top six in yardage their seasons with the Rams giving up only 293.6 yards per game and the Cardinals giving up 321.7, which may be more of a sign of the difference in the game, rather than the difference in the defenses.