Yesterday Mike Silver gave an update on the status of the contract negotiations between the 49ers and George Kittle and the update was one that 49ers fans were probably not happy to hear.
On @nflnetwork I reported that there has been no movement between the @49ers and @gkittle46 on a contract extension since some preliminary discussions in February. Kittle’s agent, Jack Bechta: “I don’t care about the tight end market. I’m being paid to do a George Kittle deal.”
— Michael Silver (@MikeSilver) May 29, 2020
These things always sound ominous but for the most part this is just normal business. So let’s take a look at Kittle’s situation right now with the team.
The important part of Silver’s report is the quote from Kittle’s agent, Jack Bechta, which is bringing to light the issue that some like myself have mentioned in the past- it is very hard in the NFL to break out of the pack when it comes to contracts. In this case the wording is very similar to what happened to Jimmy Graham years ago when he was a member of the New Orleans Saints and tried to paint a case that he was a wide receiver trapped in a tight end designation. Ultimately the Saints won out on that one and Graham signed a contract that was more or less a 10% increase at the top of the tight end market, but way under what a top receiver would earn.
I briefly talked about this on the podcast last night but one of the biggest changes in the NFL over the last 10 years has been the power of the NFL to hold down top line players from truly signing top line contracts. In the past the big name players and in turn their agents, held a lot of power, often signing record setting contracts that would withstand some test of time.
In the modern NFL the teams and their negotiators have flipped the script. One of the things we track in some of our offseason work is positional salary growth by contract ranking. The facts are that the NFL is more than willing to bump prices on the low end of the salary spectrum but hold off on doing the same for the top end players in the league. Most positions at the top don’t even come close to keeping up with the growth in the salary cap and tight end has been a position that is very typical of this.
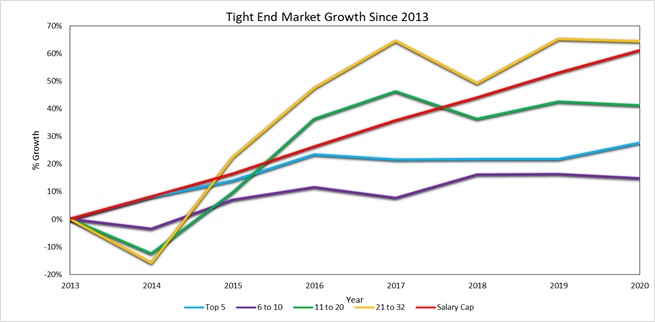
Using 2013 as our starting point you can see how the contracts that are the top 20 in the NFL have basically failed to keep up with salary cap growth over the last 7 years. In the meantime the bottom of the market has outpaced the growth of the cap. The top 10 players are basically showing a flatness over time which means there has been little to no change at all. Even as a new contract comes in an old one is dropping out.
Few players in the NFL have been able to “break the system” and become a market buster. A market buster is a player whose contract far outshines any current player at the position and in many cases will actually maintain a top contract status for some time. That second part doesn’t always happen (i.e. Todd Gurley) because sometimes the contract is the shot in the arm the position needs, but few get there. Instead the NFL has pinned nearly every player into a small positional box with very small incremental gains.
If we look at each position these would be the closest that any had to a market buster since 2014
| Position | Player | Year Signed | Annual Value | Top Market Comp | Increase |
| RB | Todd Gurley | 2018 | $14,375,000 | $8,250,000 | 74.2% |
| RT | Lane Johnson | 2016 | $11,250,000 | $8,000,000 | 40.6% |
| LB | CJ Mosley | 2019 | $17,000,000 | $12,500,000 | 36.0% |
| LT | Laremy Tunsil | 2020 | $22,000,000 | $16,500,000 | 33.3% |
| G | Kelechi Osemele | 2016 | $11,700,000 | $9,500,000 | 23.2% |
| Edge | Khalil Mack | 2018 | $23,500,000 | $19,083,333 | 23.1% |
| IDL | Aaron Donald | 2018 | $22,500,000 | $19,062,500 | 18.0% |
| WR | Julio Jones | 2019 | $22,000,000 | $19,250,000 | 14.3% |
| QB | Aaron Rodgers | 2018 | $33,500,000 | $30,000,000 | 11.7% |
| TE | Jimmy Graham | 2014 | $10,000,000 | $9,000,000 | 11.1% |
| C | Brandon Linder | 2017 | $10,340,600 | $9,400,000 | 10.0% |
| CB | Byron Jones | 2020 | $16,500,000 | $15,050,000 | 9.6% |
| S | Landon Collins | 2019 | $14,000,000 | $13,000,000 | 7.7% |
Hopefully we did not miss anyone here (im not including Revis’ inflated Patriots deal in 2014) and there are probably a few you could argue with in particular Gurley and Johnson. The argument against Gurley is that they already were valuing him as a transcendent player and the true comparable for that was Adrian Peterson whose contract was long gone but could have been used as a basis. Lane Johnson was paid what he was paid because the expectation was that he would be signed as a left tackle if he made it to free agency. Some might also put Osemele in the same class. Those are three of the biggest numbers here and Gurley and Johnson really skew the averages going from 18% to 24%.
If we apply each of the percentages to Kittle using the current top market contract of $10.5 million per year we come up with the following list of outcomes.
| Position | Increase | Implied Salary |
| RB | 74.2% | $18,295,000 |
| RT | 40.6% | $14,766,000 |
| LB | 36.0% | $14,280,000 |
| LT | 33.3% | $14,000,000 |
| G | 23.2% | $12,932,000 |
| Edge | 23.1% | $12,930,000 |
| IDL | 18.0% | $12,393,000 |
| WR | 14.3% | $12,000,000 |
| QB | 11.7% | $11,725,000 |
| TE | 11.1% | $11,667,000 |
| C | 10.0% | $11,551,000 |
| CB | 9.6% | $11,512,000 |
| S | 7.7% | $11,308,000 |
| Average | 24.1% | $13,028,000 |
| Avergae (w/o Gurley/Johnson) | 18.0% | $12,391,000 |
The next question is where does he belong on this list. Using the stats from our friends over at PFF here is how Kittle’s last two seasons compared with the other players in the NFL in terms of percent of overall offensive use in a few key categories. I adjusted Kittles stats for the trade of Sanders but did not do the same if other trades occurred for other teams like that.
| Player | Position | Team Targets | Team Rec | Team Yards | Team TDs | Avg. Offensive Impact |
| Michael Thomas | WR | 30.9% | 33.9% | 35.9% | 25.7% | 31.6% |
| DeAndre Hopkins | WR | 29.9% | 30.0% | 31.7% | 32.6% | 31.1% |
| Davante Adams | WR | 26.0% | 25.9% | 27.7% | 34.6% | 28.5% |
| Terry McLaurin | WR | 20.5% | 19.5% | 28.8% | 38.9% | 26.9% |
| Julio Jones | WR | 27.0% | 24.8% | 31.7% | 21.8% | 26.3% |
| Kenny Golladay | WR | 22.4% | 19.7% | 29.8% | 32.1% | 26.0% |
| Keenan Allen | WR | 26.8% | 27.4% | 27.1% | 21.9% | 25.8% |
| Courtland Sutton | WR | 21.9% | 18.9% | 27.9% | 33.9% | 25.6% |
| Tyler Boyd | WR | 22.7% | 24.1% | 27.5% | 26.9% | 25.3% |
| George Kittle | TE | 24.9% | 26.0% | 29.2% | 18.5% | 24.7% |
| Stefon Diggs | WR | 23.3% | 21.8% | 27.0% | 26.5% | 24.7% |
| Jarvis Landry | WR | 26.2% | 24.8% | 26.8% | 20.8% | 24.6% |
| Christian McCaffrey | RB | 22.9% | 29.1% | 22.9% | 22.9% | 24.4% |
| Larry Fitzgerald | WR | 21.5% | 22.1% | 22.8% | 30.0% | 24.1% |
| Allen Robinson II | WR | 23.6% | 21.5% | 26.2% | 24.6% | 24.0% |
| Tyler Lockett | WR | 19.7% | 22.1% | 26.7% | 27.2% | 23.9% |
| Zach Ertz | TE | 24.0% | 24.1% | 23.3% | 23.6% | 23.8% |
| Amari Cooper | WR | 20.4% | 20.5% | 24.6% | 28.6% | 23.5% |
| Odell Beckham Jr. | WR | 23.9% | 21.7% | 25.4% | 22.1% | 23.3% |
| Travis Kelce | TE | 24.0% | 25.5% | 25.3% | 18.1% | 23.2% |
| John Brown | WR | 21.3% | 18.3% | 24.8% | 28.2% | 23.1% |
| A.J. Brown | WR | 20.0% | 17.5% | 26.6% | 27.6% | 22.9% |
| Robby Anderson | WR | 19.2% | 16.6% | 23.0% | 31.9% | 22.7% |
| Julian Edelman | WR | 22.6% | 22.6% | 23.0% | 22.0% | 22.5% |
| Mike Evans | WR | 21.1% | 19.3% | 25.5% | 23.2% | 22.3% |
The big takeaway here is that Kittle has been the top performing tight end, just clearing the top 10 at the position. The negative is that the list also has two other tight ends on it- Zach Ertz and Travis Kelce, both of whom are currently signed to “tight end market” contracts.
From a historical standpoint there have been other tight ends to have offensive impact comparable to Kittle’s though the names to pay attention to here are the ones that pulled it off multiple times in back to back kind of seasons. Here are the top 30 tight end seasons using the same impact percentages.
| Player | Year | Team Targets | Team Rec | Team Yards | Team TDs | Avg. Offensive Impact |
| Vernon Davis | 2013 | 22.8% | 22.5% | 27.5% | 61.9% | 33.7% |
| Gary Barnidge | 2015 | 21.3% | 21.6% | 25.2% | 45.0% | 28.3% |
| Rob Gronkowski | 2011 | 20.6% | 22.4% | 25.2% | 43.6% | 27.9% |
| Greg Olsen | 2014 | 25.1% | 27.5% | 27.8% | 27.3% | 26.9% |
| Vernon Davis | 2011 | 22.4% | 24.3% | 24.9% | 35.3% | 26.7% |
| Jimmy Graham | 2013 | 22.2% | 19.3% | 23.5% | 41.0% | 26.5% |
| George Kittle | 2018 | 27.1% | 26.7% | 32.5% | 19.2% | 26.4% |
| Delanie Walker | 2015 | 25.3% | 27.8% | 28.3% | 24.0% | 26.4% |
| Rob Gronkowski | 2014 | 22.0% | 20.9% | 26.3% | 35.3% | 26.1% |
| Kyle Rudolph | 2012 | 19.1% | 17.7% | 16.9% | 50.0% | 25.9% |
| Jordan Reed | 2015 | 21.1% | 22.5% | 22.2% | 36.7% | 25.6% |
| Jack Doyle | 2017 | 22.8% | 27.7% | 21.1% | 30.8% | 25.6% |
| Travis Kelce | 2017 | 23.7% | 23.2% | 24.2% | 30.8% | 25.5% |
| Greg Olsen | 2015 | 24.9% | 25.7% | 28.5% | 20.0% | 24.8% |
| Mark Andrews | 2019 | 23.6% | 22.1% | 25.4% | 27.0% | 24.5% |
| Kyle Rudolph | 2016 | 22.1% | 20.3% | 20.6% | 35.0% | 24.5% |
| Greg Olsen | 2013 | 23.7% | 25.0% | 24.1% | 25.0% | 24.5% |
| Zach Ertz | 2018 | 24.3% | 25.0% | 23.2% | 25.0% | 24.4% |
| Jared Cook | 2018 | 20.5% | 18.9% | 23.7% | 33.3% | 24.1% |
| Travis Kelce | 2015 | 22.4% | 23.2% | 25.1% | 25.0% | 23.9% |
| Travis Kelce | 2016 | 21.9% | 23.2% | 28.7% | 21.1% | 23.7% |
| Antonio Gates | 2014 | 18.2% | 18.1% | 19.1% | 38.7% | 23.5% |
| Greg Olsen | 2012 | 21.5% | 24.3% | 21.5% | 26.3% | 23.4% |
| Travis Kelce | 2019 | 24.4% | 25.7% | 26.2% | 16.7% | 23.3% |
| Travis Kelce | 2018 | 23.6% | 25.2% | 24.4% | 19.6% | 23.2% |
| Zach Ertz | 2019 | 23.6% | 23.3% | 23.4% | 22.2% | 23.1% |
| Rob Gronkowski | 2015 | 19.6% | 17.9% | 24.5% | 30.6% | 23.1% |
| George Kittle | 2019 | 22.6% | 25.4% | 25.9% | 17.9% | 23.0% |
| Greg Olsen | 2016 | 23.8% | 26.1% | 27.1% | 14.3% | 22.8% |
| Jimmy Graham | 2011 | 22.8% | 20.8% | 23.7% | 23.9% | 22.8% |
I think this is where the numbers become a little more difficult for Kittle. His two years certainly rank with the best of the players but there is nothing that would push him significantly over names like Graham, Gronkowski, or Kelce. On top of that Kittle does not have the kind of sillier stuff to fall back on like draft status, having a team trade up for him, etc…That probably makes the argument much more difficult from his perspective, especially when negotiating against one of the most prepared contract guys in the NFL, that he should bust the position the way others have.
With that in mind I think I would say its unlikely that he hits the high points of the market buster charts. He next question is what should be the top market growth that we should expect. The Graham contract probably adds in some context with an 11.1% growth over the prior high water mark. This should be the floor as they are very comparable players. Based on the chart that would put a fair offer to be just at $11.7 million a season.
The only other big mover at the position has been Gronkowski. His 2012 contract was about a 22% increase over the top market at the time. That would put Kittle at $12.8 million on a year. That is probably a realistic ceiling and would be an average “market buster” type of raise.
How can you split the difference of those numbers? That probably comes down to a few factors. Gronkowski pretty much handed his career away to the Patriots when he signed that contract. His ultimate contract locked him in at 2012 prices through 2019. Even after being traded this year his 2012 contract is more or less the contract that is valid for the Buccaneers. His percent of guarantee was around 34% of the total contract value.
Graham on the other hand took a four year contract that allowed him another free agency opportunity early on. He would receive a 52% guarantee on the contract. Graham wound up earning $62 million from 2014 to 2019. In contrast Gronkowski, assuming he plays this year, will earn around $59 million and he only reached that number because they were able to maneuver some incentives into his contract at a later date. He was locked into that $54 million if not for that.
The 49ers of course will always have the leverage of the franchise tag as well. This year the number is only $10.6 million and with the pandemic possibly stunting cap growth it could actually fall next year. Even if there is little impact how much would it be? $11 million or so probably. That would put his second tag at $13.2 million. Often those numbers are used to begin baseline negotiations and cash expectations and these fall right into the numbers we discuss above using Graham and Gronkowski as comps.
This isn’t to say that Kittle cant break into the “WR Tier” which is around $16 million a season as unforeseen things always happen in the NFL but this is definitely an uphill battle to see that kind of raise at any position let alone tight end.