While we did a big study of free agency in our free agency guide I have gotten a number of question about team specific results. Rather than look at overall free agent decisions for now I wanted to look at the success rates on longer term contracts for each team from 2017 to 2020.
For this group I looked at all players who signed a contract that was at least three years in length as a free agent (street free agents qualify, but franchise players would not) and switched teams. If a player was extended I considered the contract to be complete even if the player technically is still playing on the old years of the contract. Such players would finish 100% of their contract. If the player is still active I included just the years they could have possibly completed in the equation, so they will have completed 100% of the years played so far on a contract. For everyone else whether cut, traded, renegotiated their salary down, etc…I considered the contract to have ended such that if a player only completed 1 year on a four year deal they would be considered to have completed just 25% of the contract. I did the same kind of calculations for salary actually earned vs salary that could have been earned. Each group was then added up to determine the percentages completed of the deals.
Now its important to note that the results here are going to skew more negative on teams with older contracts and positive on teams with newer contracts but for a quick run through this was the easiest thing to do. Its also further screwed up a bit by Covid opt outs but I don’t really have a good answer for how to tackle that at the moment. Here is a look at the total APY spent on player contracts and the % of possible years completed for each team.
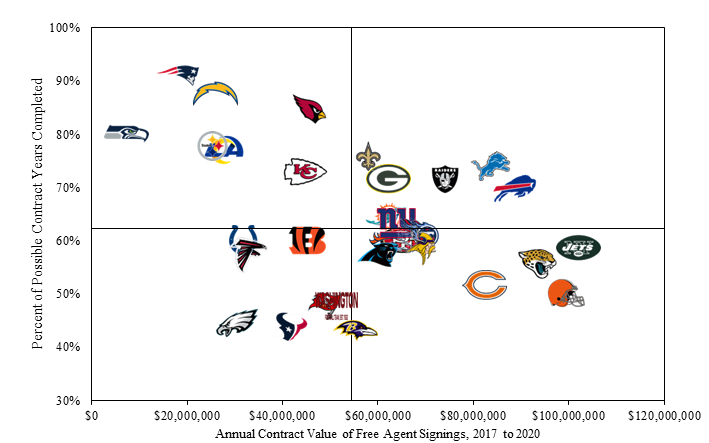
The teams in the top left quadrant had pretty successful targeted runs thus far in free agency. While they did not spend much on their team they seemed to get the matches right on cost and years on the contract. Teams in the top right spent a lot and have gotten a decent return so far. The bottom left didn’t spend much and didn’t really do a good job with those players either. Teams in the right are the ones really over abusing free agency, spending a lot of money adding tons of years to contracts and moving on from those contracts pretty early.
If you are searching for the Cowboys you wont find them so don’t go crazy looking. This is because they hardly spent anything and had such an awful return it messed up the graph. Ill put them at the end in a table, but that’s why I did not include them.
On average teams wound up adding about $54 million per year in long term contracts over the four year period with an expected return of about 62% of the contract length. This number will fall over time since players signed in 2019 and 2020 with guarantees are basically protected from release due to salary and I think based on the free agent guide data the actual success rates will be closer to 40 to 45% but that doesn’t give us a good look at the current organizations.
On a per contract basis (adjusted for years) the teams spending the most were the Jaguars at a crazy $12.1 million per year. The Chiefs were next at $10.9 million a year followed by the Packers ($10.6M), Jets ($9.8M), and Vikings ($9.7M). The Chiefs and Packers have few signings which is why the large cost and the Vikings number is inflated because of Kirk Cousins. The Jaguars and Jets just signed a lot of expensive guys with no return. The worst returns on investment thus far are the Cowboys, Bengals, Texans, Eagles, and Vikings. For many of those teams it is because the contracts are early and often contracts are frontloaded.
Here is the listing of all the teams.
| Team | Players | Added Annual Value | Possible Years | Completed Years | % Completed | % Earned | Avg. Contract Signed | Current Average Paid | Annual Value Difference |
| Patriots | 3 | $18,205,000 | 11 | 10 | 90.9% | 104.5% | $7,017,917 | $7,549,147 | $531,230 |
| Chargers | 3 | $26,116,667 | 8 | 7 | 87.5% | 81.2% | $9,160,000 | $8,478,571 | -$681,429 |
| Cardinals | 6 | $45,921,667 | 13 | 11 | 84.6% | 89.1% | $7,467,045 | $8,039,489 | $572,443 |
| Seahawks | 2 | $7,429,167 | 5 | 4 | 80.0% | 87.5% | $3,735,714 | $4,112,500 | $376,786 |
| Steelers | 4 | $25,533,333 | 9 | 7 | 77.8% | 85.5% | $6,383,333 | $7,678,571 | $1,295,238 |
| Rams | 4 | $27,925,000 | 13 | 10 | 76.9% | 103.3% | $6,233,333 | $8,521,603 | $2,288,270 |
| Saints | 10 | $58,216,667 | 29 | 22 | 75.9% | 75.8% | $5,878,571 | $5,922,727 | $44,156 |
| Lions | 10 | $83,750,000 | 23 | 17 | 73.9% | 81.1% | $8,918,421 | $9,423,438 | $505,016 |
| Chiefs | 4 | $45,000,000 | 11 | 8 | 72.7% | 79.9% | $10,928,571 | $12,299,219 | $1,370,647 |
| Packers | 6 | $62,500,000 | 14 | 10 | 71.4% | 85.9% | $10,590,909 | $12,893,897 | $2,302,988 |
| Raiders | 9 | $74,434,166 | 21 | 15 | 71.4% | 83.4% | $8,466,774 | $8,795,333 | $328,559 |
| Bills | 15 | $88,745,834 | 46 | 32 | 69.6% | 75.0% | $6,078,302 | $6,497,610 | $419,308 |
| Dolphins | 7 | $61,983,333 | 14 | 9 | 64.3% | 65.0% | $9,654,167 | $9,672,222 | $18,056 |
| Giants | 7 | $64,125,000 | 19 | 12 | 63.2% | 73.7% | $9,239,583 | $10,038,358 | $798,775 |
| Titans | 9 | $68,616,667 | 31 | 19 | 61.3% | 66.7% | $7,925,758 | $8,072,502 | $146,745 |
| Bengals | 6 | $45,250,000 | 10 | 6 | 60.0% | 81.0% | $7,842,105 | $10,696,354 | $2,854,249 |
| 49ers | 9 | $65,266,667 | 35 | 21 | 60.0% | 65.1% | $7,422,973 | $7,966,956 | $543,983 |
| Colts | 5 | $32,100,000 | 15 | 9 | 60.0% | 69.2% | $6,420,000 | $7,366,667 | $946,667 |
| Vikings | 7 | $69,066,667 | 22 | 13 | 59.1% | 71.3% | $9,708,000 | $12,115,625 | $2,407,625 |
| Broncos | 9 | $62,941,667 | 22 | 13 | 59.1% | 69.2% | $7,385,833 | $8,060,181 | $674,348 |
| Jets | 11 | $102,175,000 | 29 | 17 | 58.6% | 64.3% | $9,979,487 | $10,835,867 | $856,380 |
| Panthers | 7 | $60,526,666 | 21 | 12 | 57.1% | 63.7% | $8,667,917 | $8,523,958 | -$143,958 |
| Falcons | 5 | $33,058,333 | 14 | 8 | 57.1% | 70.1% | $6,681,250 | $6,731,250 | $50,000 |
| Jaguars | 8 | $93,383,333 | 27 | 15 | 55.6% | 61.4% | $12,083,333 | $13,717,500 | $1,634,167 |
| Bears | 10 | $82,583,333 | 31 | 16 | 51.6% | 64.6% | $8,400,000 | $9,785,409 | $1,385,409 |
| Browns | 13 | $99,674,999 | 38 | 19 | 50.0% | 65.0% | $7,913,043 | $9,856,482 | $1,943,439 |
| Buccaneers | 8 | $49,083,334 | 23 | 11 | 47.8% | 59.4% | $6,173,077 | $7,822,727 | $1,649,650 |
| Redskins | 7 | $51,250,000 | 21 | 10 | 47.6% | 62.2% | $7,900,000 | $9,302,978 | $1,402,978 |
| Eagles | 5 | $30,675,000 | 9 | 4 | 44.4% | 76.7% | $7,458,333 | $9,960,147 | $2,501,814 |
| Texans | 6 | $42,000,000 | 16 | 7 | 43.8% | 59.1% | $7,075,000 | $9,638,393 | $2,563,393 |
| Ravens | 8 | $55,566,666 | 28 | 12 | 42.9% | 53.7% | $7,208,036 | $7,731,250 | $523,214 |
| Cowboys | 3 | $11,833,333 | 7 | 1 | 14.3% | 31.1% | $3,944,444 | $9,500,000 | $5,555,556 |