[adsenseyu1]
Last year I developed a basic matrix to use to evaluate draft selections and wanted to see where picks were under and overvalued. This year I wanted to revise the look at how much teams may be overpaying at the top of the draft, but instead with a look at what are the years covered by the contract rather than a career perspective.This is important because it is during those first years where teams form opinions on a player and where their greatest contributions actually occur, since they are so cheap compared to their veteran counterparts.
To accomplish this I turned to Chase Stuart of Football Perspective who developed his own draft performance chart by looking at the first five seasons of a players career. While the methodology is different than what I had done last year the relative results should be pretty similar. For salary, I just want to look at the guaranteed portion of the rookie contract since that is essentially our risk factor in making a selection. In essence each team strikes a blind option at a guaranteed value with the expectation of some type of performance. For the guarantees I am using my own estimates based on past draft history with one slight tweak and that is to give move second rounders a full guarantee for the 2014 and 2015 seasons. Current procedures for that round would be to guarantee a signing bonus along with just their 2015 salary, but my feeling is that if you guarantee a full salary in 2015 that 2014 salary is virtually guaranteed anyway. For 3rd round and later picks the only salary is the signing bonus.
The following chart plots the FP AV for each draft slot against the guaranteed portion of a player contract. When plotting this I am making the assumption that the first pick in the draft is properly priced such that the two lines will begin at the same point.
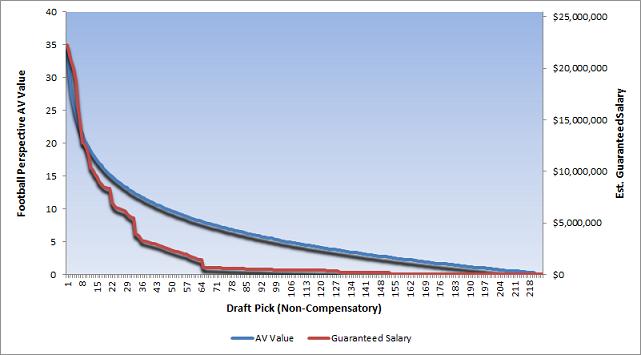
Similar to last years look at the payment for draft picks, we come away with a similar takeaway in that the top picks in the draft are essentially overvalued with teams overpaying for the expected return at the draft position. Since we are only taking guarantees into the equation rather than full contract values the picks more or less remain at a bargain price until we reach the late 7th round. However if a team believes that it does need at least one season to evaluate a player (and most would) and we add the minimum 2014 salary to each players guarantee than the draft becomes overvalued again late in the 6th round, right around pick 183.
In terms of where we find the most bang for the buck, basically defined as the minimum dollars per AV, its the first pick of the 3rd round if we assume every player will earn at least $420K in additional guarantees. If we dont take the first year salary into account it would be the 163rd pick in the draft. The worst valued picks under the two scenarios are the last pick in the draft and the 4th pick in the draft, respectively.
Considering the upside that does exist with the higher draft picks, which could probably be seen by looking at deviations from the expected results, I would come to a similar conclusion that the optimum place to draft would be in the late first and early second rounds. I see that as a financial minimization of risk with a high potential upside. I would also probably consider any pick in the late 6th round and any pick in the 7th round to essentially be worthless in a trade since most are just throwing money away and just add to the cost.
For example lets say I want to move down from 145 (AV 2.9) to 158 (AV 2.4) and I’ll pick up 210 (AV 0.6) along the way. Thought my value shows I may be getting more from the deal I have now gone from paying $188,880 in guarantees for pick 145 to $221,648 in guaranteed for 158 and 210. The team that moved up is paying $65,131 per AV compared to the team going down paying $73,883 per AV. Considering the odds are against the 210 pick being valuable its essentially an overpayment on a trade.
Likewise we can see the benefits for a risk averse team moving down in the draft. In this example we look at a team trading away the 10th, 42nd, and 125th picks to give equal value for the number 1 pick in the draft. The guaranteed structure for the team acquiring picks amounts to $15,634,120 compared to the $22,272,988 in salary the number 1 pick will get. I think you can make an argument for both sides here since the number 1 pick does have a great upside while the 10 and 42 both carry decent upside at a bargain price. I would tend to think this is one of the reasons the Raiders made the trade out of the 3 spot with Miami last season as they wanted to be more risk averse with their money while the Dolphins were looking for more of a home run despite the cost. They essentially created a nice portfolio of picks at a lower cost.
One thing that is clear with Chase’s charts, what I had worked on before, and a number of others is that the Jimmy Johnson trade value chart doesn’t really hold up, primarily because the top picks are valued so highly in the JJ draft chart. However when we plot the guarantees versus the Johnson chart we get a pretty interesting visual.
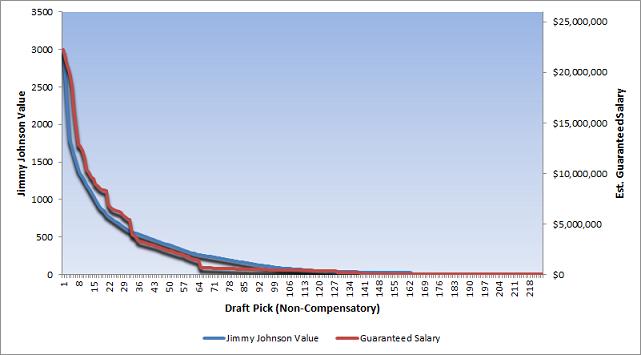
In this case our guarantee structure runs much more in line with the Johnson trade value chart than with the alternate value charts. In this case our picks through round 1 are somewhat overpriced and moving down in the draft is going to cost you far more guaranteed dollars to make the trade values match. In this system moving from number 10 to number 1 would seem to require at least an additional 1st round pick from the 2016 draft. Lets assume that to move up we would need to give up the 10th pick in each of the first 4 rounds of the draft plus an average 1st rounder (assumed to be 16) in the next draft. At this point we are still 300 or so points short but are going to lay out $25.3 million in guarantees rather than keeping our $22.3 million number 1 overall pick. Our risk is better diversified but now the team is paying more for the right to diversify. If this chart was accurate that would make trading down a harder decision to make.
Now at the time Johnson developed his chart the idea of guaranteed salaries was not really something that existed. Even now the league does not mandate guaranteed salaries. They simply mandate a signing bonus, which was the only guarantee in the earliest days of the salary cap. How do those numbers look when plotted against the Johnson value chart?
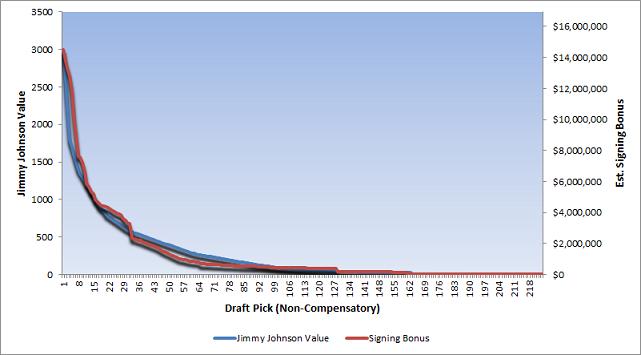
In this case its almost a perfect hit. If we do the trade talked about above the team acquiring the number 1 pick takes on $14.518 million in a signing bonus and the team moving down takes on $15.098 million in bonus money. All told it is pretty close and just a slightly higher price to pay for the diversified risk. The league formula for how they calculated signing bonus money and rookie pool money is proprietary, but it sure seems as if they also worked off the original trade value chart or something extremely similar, when developing bonus structures for the incoming rookie players.
Considering the flaws in the draft value chart it has definitely led to an improper distribution. For teams that are employing more analytics and blending that with their salary analysis it may lead to a culture of trading down with teams using old value charts or teams convinced that there is no chance of a particular player busting when jumping up in the draft. Let’s see how things shake out this draft week and which teams fit into these categories.
[adsenseyu2]
[adsenseyu4]
[subscribe2]