Last year I worked on a draft valuation project that got a bit of attention and I wanted to update the charts for the year. Essentially what we have done is to rework the old trade value charts as developed by the Dallas Cowboys with a financial model that turns every draft slot into an expected salary. The salary reflects the equivalent performance a team would expect from a veteran player that could potentially be signed in free agency. Effectively this allows us to assign a “market price” to a player before he ever steps onto the field. So Ill rehash some of that in here and post the updated numbers for the season.
The Metrics
While in the future I would like to fool around with this by using things like PFF ratings the best way I found to rate players was by using Approximate Value as defined by Pro Football Reference. When we look at AV we want to use a 4 year window to match the rookie contract length. So our value for a draft pick is the AV from years 1 through 4 of their career. There might be a more comprehensive model that could be built by using yearly values to better account for team situations and weigh the value by year, but for our analysis this works pretty well.
To come up with the average score I looked at every draft from 1994 through 2012 and compiled the combined AV for every draft pick made in that time frame. Each slot was then broken into quartiles to determine performance ranges that we can expect for the players. We set our upper limits using the IQR for each slot (the lower limit in almost all cases was going to be 0). Originally I was going to adjust for outliers but once I started looking at the data in many cases that didn’t seem to make sense since there is no logical reason for say a player drafted at 13 to be an outlier for that individual selection but be fine for pick 14-20.
Similarly I looked at every veteran player that has been in the NFL since 2012 and determined their combined AV for that four year period. Each player’s APY was then used as the salary basis for the player. The one limitation of that is that for some players that had multiple contracts over that time period I am using their most current negotiated deal. While that may not be perfect I think for the sake of these posts it’s fair to use.
The Salary Calculation
With that data we can now create a matrix that allows us to determine the average veteran salary that corresponds to the expected AV range for each draft pick. There are different ways to use the financials, which I’ll touch on in some later posts, but the most basic method is to simply average the dollars across each quartile.
So let’s look at the number 1 overall pick for a quick overview of how the process works:
| Draft Pick AV Range | Avg. Veteran Salary Per Year |
| 48.0-84 | $15,965,567 |
| 35.0-48.0 | $9,761,615 |
| 24.0-35.0 | $6,074,002 |
| 0-24.0 | $2,195,682 |
| TOTAL | $8,499,217 |
The way to read the table is to say that the first pick in the draft has a 25% chance of having a 4 year AV over 48, which would be the equivalent of signing a $15.965 million player, which is the average salary of all veterans who had an AV between 48 and 84. On the low end there is a 25% chance that he scores under 24 which would be the equivalent of a veteran earning around $2.2 million a season. Averaging each category out allows to assign an expected value of just under $8.5 million to a number 1 pick.
Because we get some fluky draft results, such as draft pick number 10 performing far worse than a pick after, I wanted to smooth the expectations by taking a forward average approach. This should take into account the fact that every team selecting in a given slot is likely considering drafting a player valued a few spots ahead. This also makes pretty much all our individual outliers that don’t make much intuitive sense to classify that way fit in with the expected results with few exceptions.
This was a purely subjective decision on my part just based on how we often hear draft grades give or mock draft debates on decisions. I’d be more than happy to adjust results based on alternate draft possibilities if people had any ideas on the subject. Here is the way I broke things down:
| Draft Picks | Forward Average Range |
| 1-2 | 2 picks |
| 3-5 | 3 picks |
| 6-32 | 4 picks |
| 33-97 | 5 picks |
| 98-255 | 8 picks |
Creating Value by Drafting
With the matrix calculated we now have the ability to also see the way that teams can gain value by utilizing the draft. Because every draft pick is slotted we can get a very accurate estimate of the rookie salary over four years before the draft even occurs. In almost every case the average expectation is going to be below what it would cost to sign a veteran. Those savings, theoretically, can be used to sign more veterans at other positions to best build the team. The following chart will show you the expected contribution in salary versus the actual annual cost of the contract.
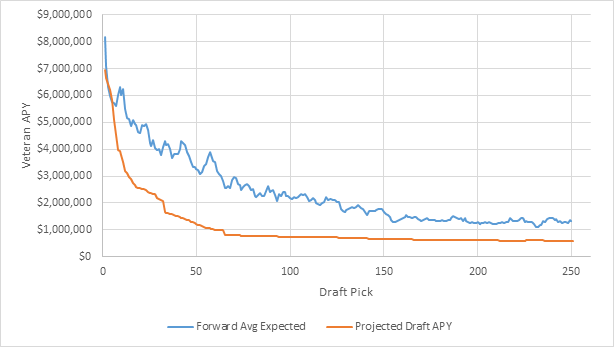
The area between the blue and red line is the savings that are realized by drafting players rather than signing them. As you can see the NFL, once we get beyond the first few picks, drastically underprices the players
When we visualize this way we should get a better understanding of why teams should look to maximize their draft selections. When we sign a player for $15 million the odds are we will never get more than $15 million in value. There is however downside in those players as you may only get $6 million in value from such a player. It is a no upside use of salary.
The draft gives us limited downside but significant upside. Here are the projected “profits” and “losses” that a team realizes if their draft picks rank in the upper 25%, average area or in the bottom 25%.
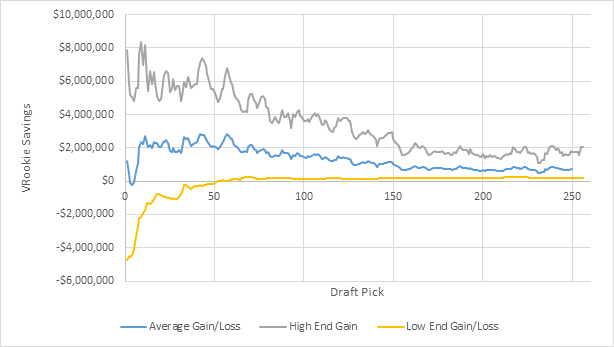
The reality is that the only picks that really carry any potential downside are the ones in the first 40 or so of the draft. Everywhere else we basically are drawing even with what we would pay a veteran for that performance even in the event the player is a bust. That is why the bust label is somewhat misused. While we expect great things from our draft picks and certain players bust relative to expectations, the team is still, more often than not, driving value from the player. The problem is that too often teams continue to chase the higher upside when it’s clear it does not exist. If those “busts” are put more in the positions they belong there is still a gain or the teams.
If teams really want to exploit a “moneyball” aspect of building a team the draft is where to do that. For example the Titans recent trade with the Rams theoretically gave the Titans something like $23 million per year in expected value but at a cost of just $13 million per year. That is $10 million in savings that should be driving from your rookies and into free agency or player retention. While there is downside to a $10 million player, that savings is essentially the same as being able to sign the same talent level of a number 1 overall pick and a mid 3rd rounder. So not only did the Titans add a ton of draft capital but the profits gained in the draft should fuel one or two big additions in free agency in 2017. That does not mean the Titans will do that, but in theory that is the way that teams should be maneuvering to maximize their budgets to get the most value on a team in a given year.