Though plenty has been written on the decline of the running back at 30, I figured why not add to that with a focus on the contract and likelihood of players performing. It’s a good topic if you are interested in working in the NFL, simply like Fantasy Football, or are going to take a more holistic look at Fantex valuations in the future. Plus with all the discussion on giving Seahawks’ RB Marshawn Lynch a raise and a new contract to reflect what he has accomplished combined with fact that a number of solid NFL running backs are about to make that turn into the late 20’s, it’s a good time to look at those late 20 years.
As a quick study I wanted to go back and look at all running backs between the year 2000 and 2013 that had at least one 100 carry season between the ages of 25 and 27. There is no magic to the 100 carries as it was just an arbitrary cutoff point that I figured would at least let us focus on players who do get reasonable use in the NFL. I also just wanted to look at players whose age 25-27 seasons all occurred in the 2000’s (so no Curtis Martin types).
All told 70 players qualified for the study. Since originally I did this with Lynch in mind I wanted to look at a three year weighted average with a team placing 50% on the 27 year old season, 35% on the 26 year old season, and 15% on the 25 year old season to set a baseline performance. I also included the regular three year average. Here is the group of players and the resulting stats:
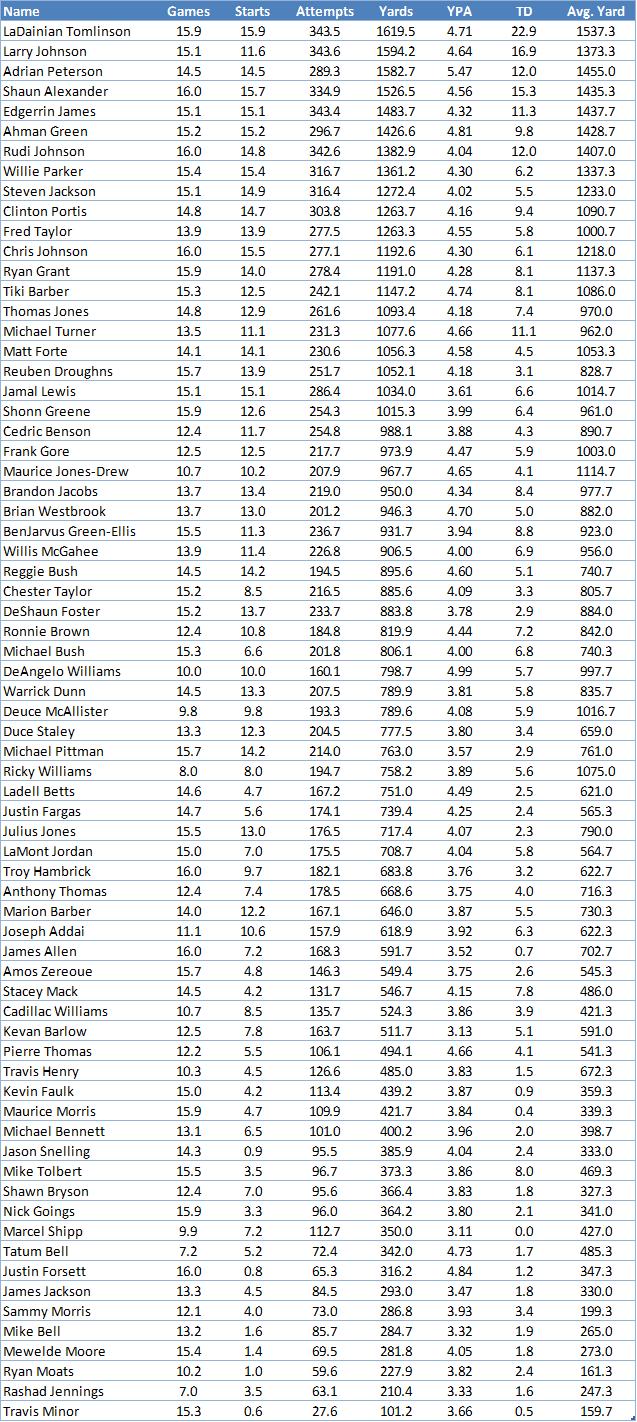
The top of the list is a who’s-who in fantasy magazine covers and I forgot just how great LaDainian Tomlinson and Larry Johnson were for a period of time. Adrian Peterson’s numbers would have been even more ridiculous if he would (or could) have been pushed the same way those others were. The first thing I want to look at is what percentage of the group (with the top number adjusted for removal of active players) remained in the NFL at each age bracket.

A majority of NFL teams have decided that by 31 most of the players no longer belong in the league, though a few make it to 33 and beyond.
How do the players fare when compared to their 25-27 weighted averages? Not very good. Here is the percentage decline for the players that remain at each age:
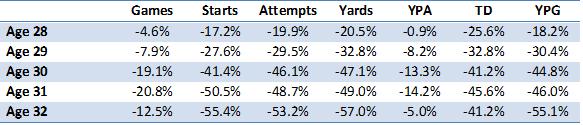
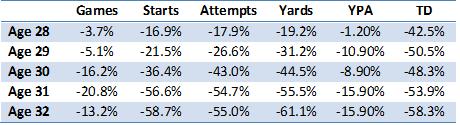
If we just look at higher end players (average above 750 yards) the declines are more or less just as steep, with slightly better yardage drops but massive drops in touchdowns, which is a huge deal for the fantasy folks.
Very few players were more productive with age. Thomas Jones, Tiki Barber, Warrick Dunn, and Frank Gore were the guys who were more productive as they got older in terms of overall yardage production. Most of the other players saw major declines.
So if we expect average performance where does that leave Marshawn Lynch and some of the comparable players going forward? I have 13 current players here that should be 28 or 29 this year and here is what the team would expect from the player in terms of yards, assuming he doesn’t flame out:

So if we are acting as the cap manager of the team it’s this forward look that we need to make when we decide on signing a player to a new contract. That’s not to say that Peterson will degrade this badly, but the expectation moving forward would be closer to this rather than where he has been for most of his career.
Of course a team should take on all factors into account when arriving at a price and the above chart gives numbers based on average performance and not being released. The threat of release has to be taken into account as does the chance of both better and worse than average performances.
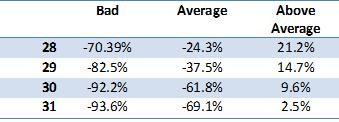
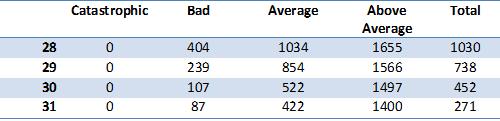
Though the sample size is not that large we can illustrate a way that a team should price point a player. We’ll use Lynch as an example because he’s somewhat relevant. What I want to do is determine likelihood of various events by breaking expectations up into 4 categories: catastrophic (cut necessary), bad (falls off cliff performance/injury), average (mid grade performance), and great (top performers). We can assign odds of the performance based on number of players who rate in that level, but to make things easier Ill just break the non-release categories into three groups and use the average of each. This is more or less what I would refer to as using financial scenario modeling to build a contract value.
Here are the expected increase or decrease in yards (based on the 3 year weighted average) per year:
Combining that with the life cycle numbers from above we would need to weigh Lynch’s yardage as follows:
When I come up with a value for a contract I need to base my thoughts on getting around 2,500 yards over a 4 year period from Lynch. More likely I would look at this chart and say he will likely be worthless to the team at the age of 30 and 31. Of course we can adjust various scenarios by varying the expectation levels beyond here, which is probably wise to do if in a bidding war with another team or you reach an impasse and need to determine how far you can go.
Using these numbers I would match a contract with each figure. Just as a rough estimate I would say a 1,000 yard runner is worth around $5.5 million, a 750 yard runner around $3 million and the last two years the minimum which is around $1 million. All told I would not offer a contract more than 4 years for $10.5 million in realistic dollars.
What I mean by realistic dollars is that the salary offered in 2016 and especially 2017 is worthless since he will likely be cut. If I believe strongly in Lynch I might offer close to $10.5 million over the first two years and fluff up the rest of the deal with money that I know will never be earned.
Now the other day I did say that perhaps a solution to the Lynch situation might include a signing bonus and we can use these charts to provide guidance on that. Knowing the odds of needing to release him the following year we can come up with an average amount of dead money we would anticipate based on signing bonus levels. The following table shows how much dead money we would allocate to Lynch in each year based on signing bonuses of $6, $4, and $2 million on a two year extension. Please note the age 29 row includes dead money from his current signing bonus as well.
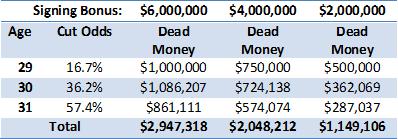
Based on these numbers I would say that the team should consider no more than a $4 million signing bonus, half of which will likely result in dead money. Using a format like this can actually help identify how much dead money a team can anticipate each year on the books if we analyze every player on a roster and assume teams did not let the cap dictate roster status.
Lynch is already scheduled to earn $5.5 million this year so there would be basically no reason to touch Lynch’s contract at all right now as he is valued right in 2014 and there would be no benefit to a signing bonus to pacify him unless he reduced his salary in 2015 to the $4 million level. Considering he is looking for a raise I cant see him being agreeable to any deal. About the only way to get a deal both sides would be happy with is to include escalators or incentives that paid Lynch larger sums of money if he was in that rare group that continued to play well into their 30’s. Otherwise it’s contract reduction not increase for him and likely for many others who will soon be in similar situations.
[subscribe2]