The 5th year option decision for the 2018 draft class was today and there were some questions about how the new rules would impact the process. The new rules fully guaranteed the option at the date it was exercised compared to just injury guaranteed and also reduced the cost for some picks while raising it for others. Whatever concerns there were may not have been warranted with the 2018 draft class having the second highest option rate since the option was instituted in 2011 and the highest ever for the top 10 picks in the draft.
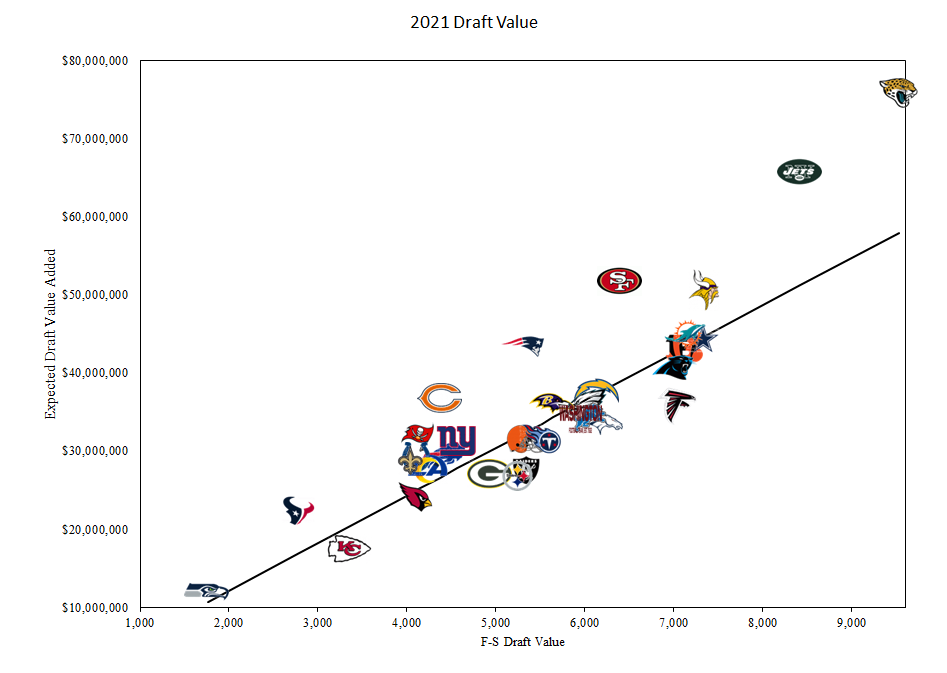
With the NFL draft now complete I wanted to take a look at the teams that added the most value to their teams in the draft. To calculate value I went back and looked at the Fitzgerald-Spielberger draft points for each slot and converted those back into the percentages to reflect the expected contract value for each draft slot. That was then multiplied by the current top 5 contract average for the draft pick’s position to determine what the value added to the team should be if the pick meets the average expectation. For example the top pick in the draft is expected to return about 98% of the top five value at the position meaning Trevor Lawrence should provide the Jaguars with about $37 million in value per year.
I added all the teams values to the chart below. The line represents what value the team would have realized if they had taken the average salaried position at every pick. Teams above the line made better use of their draft capital by typically drafting premier salary positions while those under the line spent their draft capital on less valuable positions.
The quarterback decision drives a lot of the value in the draft because the position is simply so valuable compared to everyone else that you can pick. If any of those players hit it will completely change the fortunes of the team. For those who did not take the most optimum of positions they need the players they drafted to hit in a major way to have the draft impact they need to improve. The picks that stand out the most in that regard are Kyle Pitts, Penei Sewell, Landon Dickerson, Alex Leatherwood, Josh Myers, Creed Humphrey, Evan McPherson, Alijah Vera-Tucker, Najee Harris, and Travis Etienne.
The teams that derived the most value overall in the draft were the Jaguars ($17.8M over average), Jets ($14.4M), 49ers ($12.8M), Patriots ($11M), and Bears ($10.2M). The least value went to the Falcons (-$7.2M), Steelers (-$5.3M), Raiders (-$5M), Broncos (-$4M), and Chiefs (-$3M).
While teams are limited in signing bonuses paid to undrafted free agents there are really no limits on what they can offer as a guarantee to a player. Priority free agents can sometimes land big guarantees- 77 players in the last two years have received a guarantee that is larger than the guarantee that will be paid to the final pick in this years draft. Last year there was even a player who received a $180,000 guarantee- basically the same amount committed to an early 6th round pick. With the UDFA firestorm about to begin I thought it might be interesting to look at the teams who have looked at UDFAs the most over the last two years.
Four teams have signed at least forty players in the last two years. The Jaguars, who have been bad, lead the way and I am sure are the team most would have guessed as the most active, but the next three teams probably not. The Ravens, Rams, and Chiefs are the others over 40 and all with a very different approach. The Ras spend very little on their signings with an average guarantee of just $4,700 all coming as a signing bonus. The Ravens are around the NFL average at $15.6K per player. What about the Chiefs? They aim high with over $31K in guarantees per player, 9th highest in the NFL. Also notable is that these four teams are among the lowest spenders on signing bonuses (in large part because the NFL limits the number) so they should have chances to offset these guarantees if cut.
The team that guarantees the most is Dallas and it is not even close. They have averaged $71.4K per player in guarantees, about $15K more than the Patriots who rank number two. Both rank relatively high in bonus spending too and given that they rank in the middle of the NFL in UDFA signings that probably makes these two of the top targets for UDFAs looking for the best offer. The 49ers and Eagles round out the teams who are over $40,000 in guarantees per player.
Who doesn’t really look at undrafted players? The Football team has only signed 17 post draft UDFAs over the last two seasons, the only team under 20. The Bills have 20 signings while the Raiders have 21. The Panthers also have 21 but with a very wild split- 4 signed in 2019 and then 17 last year when Rhule came to the team. Washington may want to take note as they went from 13 in 2019 to 4 in 2020 which is when they brought in the old Carolina office to run the team. Detroit and San Francisco rounded out the bottom with 22 apiece. These teams, however, are very targeted. They are at the top of the NFL in signing bonus money and signing bonuses are the players to keep with no offsets. So they put forth a strong effort in signing.
Who spends the least? While on a per player basis it is the Rams, the Rams at least sign a lot of player. The Bengals rank dead last in total money guaranteed to undrafteds since 2019 by about $50,000. They rank second to the Rams with just $5,300 spent per player though like the Rams its pretty much all signing bonus money so at least there is no offset. Other teams that aim low- the Cardinals, Seahawks, and Chargers are all under $7,000 per player.
None of this means that all of these teams will or will not continue to spend but it helps give an idea as to why certain teams do seem to stand out with some of the UDFA signings. Money talks and often means opportunity.
It is important to note that teams do only have 90 roster spots to work with. Teams like the 49ers, Giants, Panthers, Jaguars, Texans, and Football Team are near those limits and may not be that interested in signing players. If they are it also means a number of players, those who likely signed futures deals, will be cut to make room. The fact that the NFL is having an offseason program that many are not attending it might make it easier for the team to consider releases for complete unknowns.
On the other end of the spectrum we have the Falcons, Seahawks, Saints, Chargers, Bucs, and Bears with minimal players under contract and in many cases very limited cap space. These are the kind of teams that need undrafteds for the summer and to compete for roster spots with veterans as the low cost is highly beneficial for the teams.
Here is the guarantee data (includes signing bonus money) for the last two years. The column headers should allow you to sort if you click on them.
Yesterday I looked at where the average top 15 player comes from in the draft and I wanted to expand on that today a little bit. The first thing I looked at this time was just expanding the numbers out to the 2nd round of the draft. The numbers in the chart represent the percentage of top 15 valued contracts that were selected in that range.
Position
% Drafted Top 10
% Drafted 11-32
% Drafted 33-48
% Drafted 49-64
% Drafted Round 1
% Drafted Round 2
% Drafted Round 3 to 8
CB
20.0%
53.3%
13.3%
6.7%
73.3%
20.0%
6.7%
LT
26.7%
40.0%
13.3%
6.7%
66.7%
20.0%
13.3%
LB
6.7%
13.3%
33.3%
20.0%
20.0%
53.3%
26.7%
IDL
13.3%
33.3%
20.0%
6.7%
46.7%
26.7%
26.7%
QB
40.0%
13.3%
6.7%
13.3%
53.3%
20.0%
26.7%
EDGE
33.3%
26.7%
6.7%
6.7%
60.0%
13.3%
26.7%
G
13.3%
26.7%
13.3%
6.7%
40.0%
20.0%
40.0%
WR
20.0%
20.0%
13.3%
6.7%
40.0%
20.0%
40.0%
S
0.0%
20.0%
26.7%
0.0%
20.0%
26.7%
53.3%
RB
20.0%
6.7%
20.0%
0.0%
26.7%
20.0%
53.3%
RT
13.3%
13.3%
0.0%
13.3%
26.7%
13.3%
60.0%
C
0.0%
6.7%
6.7%
20.0%
6.7%
26.7%
66.7%
TE
6.7%
0.0%
20.0%
0.0%
6.7%
20.0%
73.3%
The interesting numbers here is that final column. Cornerback and left tackle basically leave you no opportunity to find a star outside of round 2. The odds are also against you for linebacker, interior d-line, quarterback and edge. The linebacker number surprised me as I usually consider that a position you can draft lower but I guess while you can find good players late the stars are mainly coming in round 2. As you move down the charts you can see how certain positions are still seeing over 50% of the stars come later in the draft.
When looking at some of the draft numbers in round 2 I started to wonder if teams at the end of round 1 don’t approach the draft from an optimal point of view. This was something we noticed in our Draft book where the long term hit rates at the top of round 2 were actually a bit better than the end of round 1 even if the end of round 1 did give slightly better overall results due to less flops.
My thought was that the teams at the end of round 1 are often playoff teams and they sometimes approach the draft different having more of a short term focus where they look for an immediate need compared to the bad teams at the top of round 2 just aiming for talent. So I wanted to break down the hit rates between picks 21 and 32 and compare that with 33 through 44. In addition I looked at the percentage of draft picks at each position between 21 and 32 between 2016 and 2020.
Position
% of Picks Used, 21 to 32
Top 15 Contracts, 21 to 32
Top 15 Contracts, 33 to 44
WR
16.9%
6.7%
6.7%
CB
13.6%
26.7%
13.3%
EDGE
11.9%
20.0%
6.7%
LB
10.2%
6.7%
20.0%
S
6.8%
20.0%
26.7%
RB
6.8%
0.0%
6.7%
RT
6.8%
6.7%
0.0%
IDL
6.8%
6.7%
13.3%
TE
5.1%
0.0%
20.0%
G
5.1%
6.7%
13.3%
QB
5.1%
13.3%
6.7%
LT
3.4%
6.7%
13.3%
C
1.7%
0.0%
6.7%
In looking at the numbers I would say it is pretty clear that receivers are over-drafted at the end of the first round. Teams are investing heavy in the position and the results have been pretty poor both at the end of round 1 and start of round 2. Whatever teams are identifying in these players there are more falling through the cracks than seem to be selected in these ranges. Whether teams might want to adjust their criteria for ranking or simply wait on the position it should be open for change.
Corner and Edge are both right in their approach. They hit rates at the end of round 1 are massive and for Edge in particular the round 2 players are not there so it is a “now or never” kind of position. Running back, right tackle, and center are probably also the correct allocations.
Linebacker has two takeaways for me. One is that like receiver maybe teams need to reconsider what they are looking for with more hits coming in the front end of round two. The other is that with valuable talent seeming available in those next 11 picks that is a position that might be under drafted if teams change their approach. While the impact of the position isn’t great I could see the logic in not picking a receiver, running back, etc… and instead “reaching” for a linebacker.
Safety clearly is a position like that as well. A ton of the top deals come between 21 and 44 yet only 7% of picks are spent on safety. This is another one where if you have a safety on your board and you are contemplating between a safety and receiver or how teams currently rank a linebacker opt for the safety if the goal is finding a star.
Finally 20% of our top tight ends come from the front end of round 2. Now there are tons of tight ends available late in the draft so while I would rarely advocate for a tight end this high maybe it should be more of a consideration over a wide receiver if you must take a shot at upgrading the passing game.
With all the trade up talk surrounding the draft I wanted to take a quick look at where the top 15 salaried players at every position were drafted. For each position I put together a list that looked at the average round the player was selected, the median round for the group, the average and median pick, and finally the percentage of the top 15 drafted in the top 10 and the percent drafted in the rest of the first round.
Position
Average Round
Median Round
Average Pick
Median Pick
% Drafted Top 10
% Drafted 11-32
CB
1.33
1
28.0
24
20.0%
53.3%
LT
1.53
1
29.3
16
26.7%
40.0%
QB
2.07
1
46.8
24
40.0%
13.3%
IDL
2.07
2
51.0
37
13.3%
33.3%
EDGE
2.13
1
52.5
22
33.3%
26.7%
G
2.40
2
62.4
35
13.3%
26.7%
WR
2.47
2
65.0
47
20.0%
20.0%
LB
2.67
2
71.7
47
6.7%
13.3%
S
2.80
3
75.3
64
0.0%
20.0%
RB
3.07
3
85.7
67
20.0%
6.7%
RT
3.93
3
115.7
67
13.3%
13.3%
TE
4.00
3
117.9
100
6.7%
0.0%
C
4.13
4
126.7
122
0.0%
6.7%
Just two positions, corner and left tackle, actually average a pick in the first round. Corner is clearly a 1st round dominant position with 73% of the top players coming from somewhere in round 1 left tackle has 67% in round 1 while the edge rusher is at 60%. The only other position with over 50% coming from the first round is QB where 53% were selected in the first round. QB is dominant for the top 10 with 40% coming from the top 10.
I think the takeaway would be if you are going to trade up into the top 10 it has to be for a QB and no other position. I think if you are going to move up in round 1 or into round 1 there is probably a case to be made that its reasonable to do if the pick is going to be a corner or a left tackle. I don’t think you would put Edge in that group though as the split is very even between top 10 and rest of round 1. That makes it a strong position if you have a top 10 pick but probably not one to move up for. On the other end of the spectrum your tight ends, centers, and right tackles come way later in the draft with average rounds close to 4 and median picks near 120. Generally teams do not draft these players high and Im not sure anything would indicate that there is an advantage to drafting the few who do grade that high since there seems to be good talent throughout. Overall I think most of those positions on the bottom of the chart likely do not even warrant a first round draft pick if there is a player who might not grade as well but is in the remote ballpark and he plays one of those top 7 spots
The other day there was an interesting tweet by Michael Lopez about valuation in the draft not taking into account the high end probabilities of draft picks. This is a topic I’ve touched on before in old posts and something Brad and I looked at a bit in our book, but the question is should teams still be trading up because of the “best case scenario”.
Generally, any move up in the draft is made because of (over)confidence in the team’s ability to pinpoint a star player. They move up believing that they have the next Julio Jones when in reality they wind up with just another guy in most cases. No team is really infallible and giving up valuable resources can ultimately have a negative effect on the team long term. Using the Falcons as an example if they were perfect every trade up would produce a mega star. It did once with Jones. They got a very good player in a move up for Desmond Trufant two years later. They got a non-player in Takkarist McKinley when they moved up in 2017. They moved up again in 2019 for Kaleb McGary who has been solid but certainly not a standout.
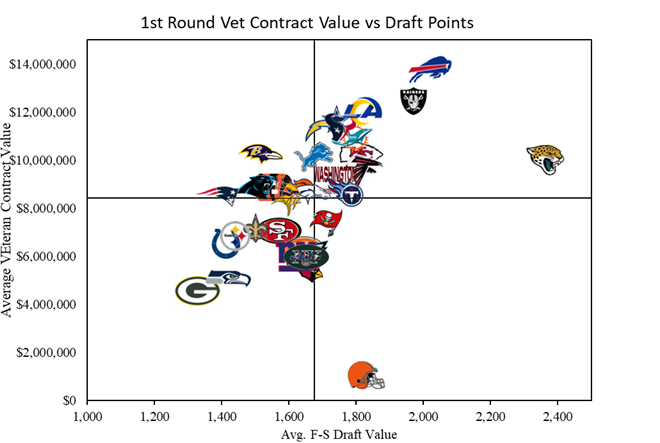
I went back and looked at every team’s performance in the first round between 2011 and 2016 by calculating the second contract annual value for the player. I was going to adjust for position but for the sake of time decided against doing that. I was also going to separate the non-premium positions, premium positions, and QB but ended up just taking out quarterback as there was little difference in the other two categories (less than $1 million a year on average). Here were the results plotted against draft capital.
While clearly teams that wind up with higher valued picks are typically drafting better players (unless you are the Browns) most teams are lumped pretty close together. The Ravens are the only team I think you could look at with any conviction and say that they really picked above expectations and the Browns the only team way under expectations. The Jaguars were just different some good and some really bad while drafting in huge expectation spots year after year.
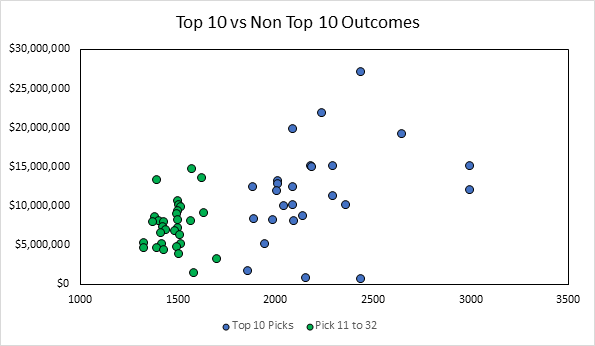
What if we separate top 10 and non top 10 picks? Here is the team by team performance.
The few teams that struck gold in the top 10 were the Chargers (Joey Bosa), Raiders (Amari Cooper and Khalil Mack), Ravens (Ronnie Stanley), and Broncos (Von Miller). The other numbers are quite similar. Did the three teams with one pick just get lucky? Probably so.
Anyway the average value of a top 10 pick was about $10.7 million and a non top 10 pick $7.3M. But what if we just want to look at high end talent? If we look at the top 25% of all non-QB picks made between 2011 and 2016 in the top 10 the average value was about $19.4 million. The average value outside of the top 10 is $15.8 million. The next 25% is $14.2 million to $9.9 million.
The concept of trading up just seems so illogical. If you believe your front office is so good that they found the one guy in the draft that is a lock to be worth around $20 million and you are going to give up an extra 1 to get there shouldn’t you also be confident enough that your guys can spot the $14.2 million player in back to back years?
To me there are two major market inefficiencies teams exploit in the draft. One is the trade ups in or into the first round for non quarterbacks. The second is the massive discounts that teams place on future draft capital for a shiny new toy from another team or for the move above in the draft. Teams give up so many potential stars for the hope of a veteran when more often than not they are better off with the draft selections.
As for QB’s it has been very hit or miss. There were 17 QB’s drafted in the first round between 2011 and 2016. Andrew Luck is the one that raised the level of his team the most though the injuries and short career hurt him. Cam Newton had a high peak and quick decline. Carson Wentz and Jared Goff were decent players whose teams grew tired of their shortcomings. Ryan Tannehill has found new life in Tennessee. The rest mainly stunk. Blake Bortles, Marcus Mariota, RGIII, Teddy Bridgewater, Blaine Gabbert, Brandon Weeden, Jameis Winston, EJ Manuel, Christian Ponder, Jake Locker, Johnny Manziel, and Paxton Lynch.
I’m not sure if all these failures were simply poor translation of college to NFL games with coaching staffs maybe not best suited to work with the strengths of some of these players. In recent years the track record has been a little better with Mahomes and Watson being stars and Jackson, Murray and Allen probably on the cusp of being stars. Darnold, Trubisky, Rosen, and Haskins stunk. Mayfield is a question mark and Daniel Jones has pretty much stunk but will get another shot this year to change the career.
The value if the QB hits is so high ($40M vs at the most maybe a $25M player) that it is worth the trade up especially because the talent is so scarce. Are the RGIII trades worthwhile? Probably not. Teams should target the Chiefs, Bills, etc… model where you give up the next years 1 rather than the massive move ups that others have done.
In reality the best course of action is to probably determine before a season begins if you are or are not in the QB market. If you are in the QB market it means you need to rebuild and you should be looking to exploit that market inefficiency for veteran players to build up draft capital if needed to move up. At least if you do that you are trading other teams picks for the right to choose a QB rather than all of your future picks (teams are not trading a top pick for veteran players unless the organization is run by Eric Mangini). You do not need to play to lose but you have to be realistic in your expectations and what value other teams may see in your roster that fits their current needs causing them to overpay. Having to gut a bad team of future good draft picks is basically a recipe for disaster.
Also a recipe for disaster is the team that refuses to embrace that they should be in the QB market. It is always better to make a pick a year early (such as Detroit last year) than waiting to watch the situation unfold and then not being in a prime position to draft a QB and needed to use more resources to find a young QB. If you are bad enough to be in the top 10 you are bad enough to be thinking QB in almost every situation other than having a true elite player (i.e. Mahomes) who missed a full year.
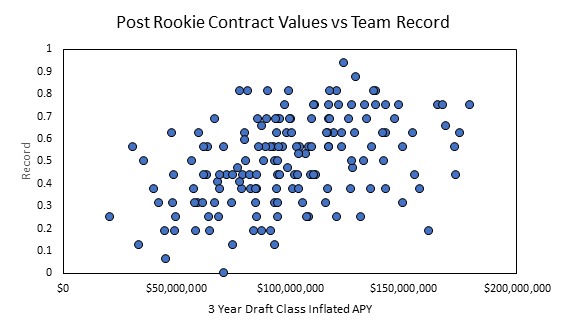
The other day I took a big picture look at rookie performance and how teams had performed from 2015 to 2020 and I wanted to expand on that a little bit to see if we could go back in time and try to put more focus on the rookie impact during those rookie years. To do this I went back and retroactively applied the second contract value for a draft pick to the team that drafted them/signed them as an undrafted player as the “player value” while he was a rookie.
To measure the direct impact I grouped rookies into three year bins for each team. Bin 1 would be rookies from 2011 to 2013, bin 2 is 2012 to 2014 and so on. We would then apply each bins value to a record in a given year, that is at least one year beyond the most recent draft class in the bin. Basically what that means is we would take bin 1 and say that that group of players directly impacted the teams record in 2014.
Just to give an illustration to explain it further here is the breakdown for bin 1. The players drafted in 2011 would be in their 4th year with the team, those from 2012 their 3rd year, and 2013 their 2nd year. By throwing out 2014 we are making the assumption that the 2014 classes direct impact is marginal. That may not be true and we could test that somewhat but for a first run through the analysis this should work ok.
Finally, to normalize the data a little bit I inflated each bins value to a $198.2 million cap which was the salary cap in 2020. While this is not the perfect way to really value contracts since the market for most positions is by no means pegged to the salary cap it is the quickest and gives fair values.
Much like the run where we looked at recent performance the impact of good draft picks is clearly important and much more so than the impact of free agents which usually does not lead to anything positive long term and in many cases not anything short term either.
We often measure success in the NFL based on playoff appearances and our typical threshold for success is 10 or more wins. I broke down the groups in above average drafting (approx. $96.5M in value for the three years of players) and below average drafting and then looked at the wins for each group. Here were the results over the five year period.
Draft Value
12+ wins
10 to 12 wins
8 to 10 wins
5 to 8 wins
Under 5 wins
Over Avg.
20
20
16
19
5
Under Avg
3
11
16
32
18
These are pretty damning numbers for teams that draft poorly and try to overcome it through alternate means like trades and free agent signings. 50% of the top drafting clubs wound up with at least 10 wins while over 60% of the poor teams wound up with a losing record.
As for the good teams who didn’t perform well in the draft- the high end teams were the quarterbacked by Ben Roethlisberger (2017), Carson Palmer (2015), and the MVPesque miracle season for Carson Wentz (2017). The 11 teams close to high end featured Andrew Luck (2014 and 2018), Palmer (2014), Roethlisberger (2016), Aaron Rodgers (2016), Russell Wilson (2016), Cam Newton (2017), Drew Brees (2017), and Tom Brady (2018). The other two were Ryan Tannehill (2016) and Ryan Fitzpatrick (2015). While both had good years nobody would consider those two high end QBs but the others were likely covering up flaws from bad drafts. Basically it is high end QBs making up for the level of play. Brady would probably show up multiple times on the list if we took out Garoppolo and Brissett from the mix as they had no value to the team winning but made up most of their drafting success.
Among the teams with good draft performance and over 12 wins you do get sneak ins by players like Andy Dalton (2015), Brock Osweiler and broken down Peyton Manning (2015), Alex Smith (2016 and 2018), Derek Carr (2016), Case Keenum (2017), Mitch Trubisky (2018), and Jared Goff (2018). You can include the Cowboys QBs in that mix a few times too if you want to have that debate. When you move the needle down further you include Joe Flacco (2014 and part of 2018), Nick Foles and Mark Sanchez (2014), Matt Stafford (2014), Smith (2015 and 2017), Teddy Bridgewater (2015), Eli Manning (2016), Blake Bortles (2017), Goff (2017), rookie Lamar Jackson (part of 2018). You can argue the pros and cons of some of these players but these are more the occasions where you can get by with a mid grade QB for a year or more when the draft quality helps out.
As for the best draft classes that is hard to say because of the way the QB position is valued. For instance the best run on drafts that we saw was the 2011 to 2013 Broncos but part of that number is inflated by Osweiler who did not contribute at all to that team. The same goes for the Jaguars in from 2014 to 2016 with Blake Bortles. That would leave the 2015 Rams as potentially the best of the bunch with their draft from 2012 to 2014. The Rams really were the team that did the least with some great drafts in that period and were sunk by the Shaun Hill, Austin Davis, Nick Foles types at QB. Here is the big list of teams with their record and inflated draft value.