Historical Performance Based on Financial Construction of the Roster

The other day I looked at how teams were spending around their Quarterbacks in 2021 and I had a few people ask about how that correlates with team success, so I went back and retroactively charted each year since 2015 to get an idea as to how teams financial construction leads to wins and losses.

For each year I calculated the team’s annual spending on all QB’s on the roster and then the annual value of the top 20 non-QB’s on the roster. Each year was broken down based on the median in the NFL for that given year to classify a team as a “high” or “low” spender in that year. We then looked at the record for each team.  Here was the initial breakdown.

QB ValueTop 20 Non-QB ValueCountWin %
HighHigh390.567
LowHigh570.538
HighLow570.491
LowLow390.391

As you can see a majority of teams fall into the category where they split the investment basically deciding to go low on the roster if they have an expensive QB or high on the roster when they have a cheap QB. The results were interesting with those who spend more on the overall team performing better than those who spend below the median for that year.  The teams that go low in both categories on average performed pretty poorly. These would be teams mainly with rookie QBs or third rate veterans and an “on paper” bad roster.

Here is how each group performed when breaking the win totals down a bit further.

QB ValueTop 20 Non-QB Value10.5+ wins8 to 10 wins5.5 to 7 wins0 to 5 wins
HighHigh30.8%30.8%30.8%7.7%
LowHigh31.6%31.6%19.3%17.5%
HighLow24.6%26.3%21.1%28.1%
LowLow7.7%20.5%30.8%41.0%

So much in the NFL is QB driven that these results make sense. High spending on a QB usually means the team is going to have a high floor which basically eliminates the disaster record. The teams with lower spending on the QB often fall into the rookie pool which has far more variance. The two have similar high end results but the low QB also led to plenty of disaster years. Teams not meeting the standards for the rest of the roster are certainly coming up short despite the fact that they should have a higher floor QB. The double lows really indicate that waiting to see if your rookie is any good or expecting a Nick Foles type of players to fix a mediocre team is not an optimum approach unless the goal is draft position.

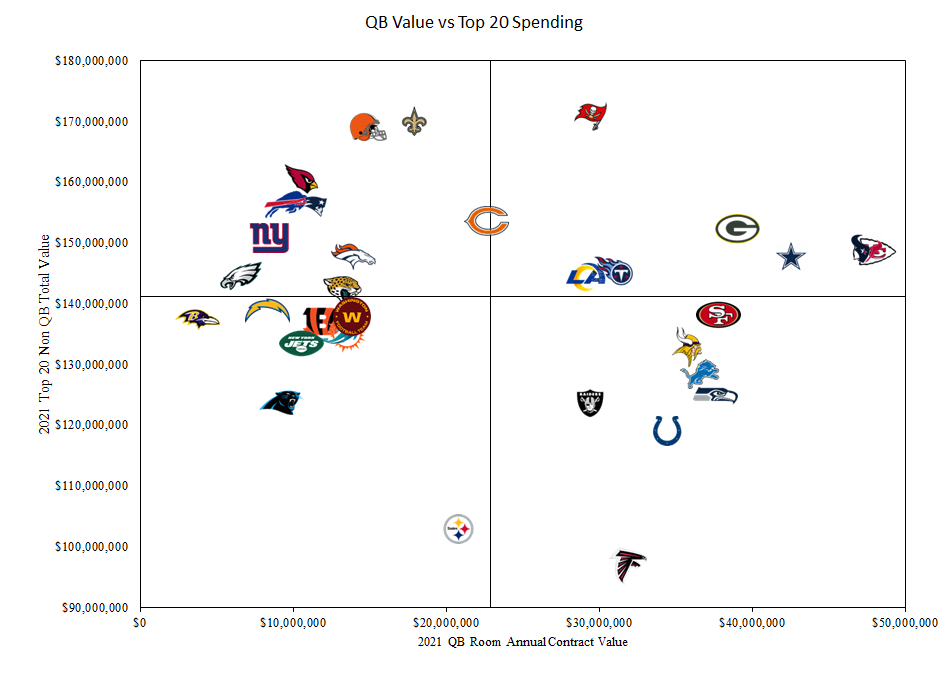
Finally, I inflated the numbers for each team based on the $198.2M cap that was in place for 2020 and made a plot of the teams sorted by three record tiers. The quadrants are based on the overall averages for the six years I looked at.  This does overstate and understate some teams since the market itself isn’t pegged to the cap but it made for a quick, easy chart.

There is a lot of green (10+ wins) in the right quadrant, about 50% of all teams, and not much red(under 7 wins), about 20% of all teams. The top left is about 35% green while the bottom right is around 30% green and the bottom left is only 13% green.

So are the lower spenders shot?  No, but there is probably something to gain from looking at how the teams are investing in their teams before the season begins compared to the rest of the league. There is still time for those numbers to change this summer but I think I’ll circle back around in September and see how the teams are looking when it is time to actually play the games.

Today I wanted to take a look at how much talent teams are attempting to surround their QB’s with in 2021. To do that I looked at how much is being spent per year on the top 20 non quarterbacks on each roster and compared that with the total expenditure on the QB room this year. Here is a quick look at how the league breaks down.

Non-QB NFL Spending

Today I wanted to take a look at how much talent teams are attempting to surround their QB’s with in 2021. To do that I looked at how much is being spent per year on the top 20 non quarterbacks on each roster and compared that with the total expenditure on the QB room this year. Here is a quick look at how the league breaks down.

The way I would read this is that teams in the top right quadrant have expensive QBs and are investing a lot in the rest of their roster despite what is being spent on the QB. Those in the bottom right are relying heavily on rookie talent and/or are relying on the QB to push them over the top. The top left are the teams with lower cost QB situations and trying to surround their teams with as much talent as possible. Those in the bottom left have cheap QB rooms but are being more cautious with their spending on the rest of the roster.

A few things stood out to me here. Of the teams with expensive QB rooms only three rank top 10 in non QB spending. The Buccaneers did everything humanly possible to come back with an intact roster and have the most expensive upper tier roster in the NFL with $170.8M per year allocated to their top 20 non QB contracts. The next six teams- the Saints, Browns, Cardinals, Bills, Patriots and Bears- all have relatively lower cost QB’s.

Of the teams that do spend above average on non-QB’s they generally the teams spending between the 10th and 16th most in the league.  That’s the basic impact of having an expensive QB either on the front end of his contract and/or doing a very good job of managing the cap charges associated with that contract.

Of the eight bottom spending teams, seven of them have QB’s that rank in the top 16 in the NFL and five of those seven rank top 10. These teams are all pretty interesting. The Falcons and Steelers position here clearly is because of salary cap disasters, though the Steelers could move up higher when/if they extend TJ Watt. The Lions and 49ers are two teams who probably have an eye more on the future than this season and are playing out the string a bit, especially the 49ers, with an expensive QB.

Seattle is an interesting team. They don’t invest a lot around Wilson but they are also in a position where they should be saving for or waiting to spend more on an extension for Jamal Adams and perhaps some future line help. The Vikings are hard to get a handle on. They fall into a weird no mans land of being heavily invested in a QB but may not have a long investment in that main QB.

The Raiders are probably just mismanaged and not taking an advantage of the fact that Carr at this point in his career is cheap and is the perfect kind of contract to surround with a ton of talent to try to take advantage of that. The Colts have some added extensions on the horizon but they also fall into that cheaper QB category from a cap perspective. Id love to have seen them take an added risk or two in free agency.

Of the cheaper QB rooms the Ravens stand out. Now if we look just at the next two years their QB room is not that cheap since Lamar Jackson has a big cap number in 2022 and is in line for a massive extension on top of that. This is probably the right call for the long term but I think its fair to wonder why they are not approaching things like Buffalo. When looking at the Bengals, Dolphins, and Chargers I think you would like to see them up a bit more as well. The young QB window is basically 3 years max with the first year coming in the second year of their career. Why not bet strong on a young player now rather than waiting until you see it for real in year 2?  Teams should be proactive in taking advantage of these windows not reactive and missing out. I’d hate to be the team that has a QB take off in year 2, lose in the WC round, and debate about how different it would be if we added two more players. Meanwhile in the back of your mind the next year is saving up for an extension and you miss the window entirely.

The other standout is Carolina. This is a team still in the middle of a major rebuild and probably salary cap constrained with an eye on some extensions. However, having gone out and traded for Sam Darnold who was a highly drafted but thus far NFL flawed QB it would seem to be an injustice to not fill more veteran talent around him. I’m not sure if this is much different than what he was in in NY except with a less intense media spotlight and perhaps a more forgiving fanbase. This is a clear team that needs their rookies and second year players to make a major leap.

I think if you are a fan of the Browns, Bills, Cardinals, Patriots, and Giants you are probably pretty happy with how their front offices are trying to win now. You can certainly argue with some of the moves and whether the contract value really matches the production (I’m really looking at New England and New York on that one) but at least they are giving it a shot when they have a good chance. If the Bears can drop off some of their veteran salary and start Justin Fields they probably fit in that same category.

Here is the breakdown of each team’s spending in 2021.

TeamTop 20 Non QB ValueQB Value
Buccaneers$170,833,213$29,533,834
Saints$170,009,126$18,028,395
Browns$168,985,599$15,008,245
Cardinals$160,368,078$10,602,161
Bills$156,098,223$9,602,749
Patriots$155,834,000$10,860,622
Bears$153,447,498$22,717,988
Packers$152,234,813$39,110,868
Giants$150,771,335$8,536,514
Texans$148,868,888$47,555,525
Chiefs$148,422,265$48,098,333
Cowboys$147,729,356$42,660,037
Broncos$147,630,765$14,015,205
Titans$145,367,557$30,975,000
Eagles$144,442,244$6,731,394
Rams$144,276,120$29,210,000
Jaguars$141,981,660$13,245,491
Chargers$138,687,610$8,419,344
49ers$137,982,949$37,866,338
Football Team$137,894,999$13,920,000
Ravens$137,265,704$3,818,085
Bengals$137,120,263$11,867,534
Dolphins$135,104,258$13,311,359
Jets$133,195,568$10,640,261
Vikings$132,763,214$35,790,853
Lions$128,367,492$36,662,500
Seahawks$124,781,247$37,652,500
Raiders$123,637,972$29,530,000
Panthers$123,580,823$9,307,673
Colts$118,990,148$34,569,492
Steelers$102,893,600$20,875,199
Falcons$96,741,401$32,025,833

Vikings Avoid Contract Dispute With Danielle Hunter

Danielle Hunter and the Vikings came to an agreement yesterday on a restructured contract which would get Hunter to report this year and end, for the time being, what had been an unhappy contract situation. While we do not have the full details on the new deal, based on reports we can piece a few things together and see why this was a pretty easy situation for the Vikings to get themselves out of.

I guess the first thing to understand is how we got here in the first place. If you are a podcast listener I went over this a few weeks ago but the short version is that Hunter took a way below market contract when he signed for $14.4 million a year in 2018. It was clear when he signed that it was a deal he would be unhappy with and by 2020 as the market turned to over $20 million a year for comparable players he was clearly unhappy with his deal. This was reported on last year and the noise became louder this offseason.

Hunter had no real leverage to negotiate a new contract at this stage. He had three years remaining on his current contract and almost no team ever rips up a deal with that many years left to negotiate a new contract. He also missed all of the 2020 season due to injury.

Occasionally when disputes like this come up the standard way to calm the situation is to move money up in the contract, basically borrowing from the anticipated “extension” year and moving it up into the “non-extension” season. This was done a few times with Antonio Brown in Pittsburgh and most recently with Stephon Gilmore in New England. The Vikings stopped a bit short of the same strategy but the concept remains the same.  

According to Nick Shook of NFL.com  the Vikings have $20 million committed to Hunter in 2022, $18 million of which will come as a roster bonus on the fifth day of the league year, which was first reported by Ian Rapoport. That would represent a $7.25 million potential raise in 2022 for Hunter over his current salary of $12 million. If the report is accurate it would seem as if the team converted most of Hunter’s 2022 salary into the roster bonus. The other part of the deal is that the Vikings took $5.6 million of his salary and paid it to him as a signing bonus.

The numbers all sound wonderful and that is what they are designed to do. Basically this was a crisis management episode for Minnesota and they did what they could to placate the situation. In reality nothing materially changes for them at all

Based on the report he did not a receive a raise this year at all. They simply opted to pay him a portion of his salary now (or whenever the bonus is paid) rather than during the year. While the money sounds huge next year and the bonus clearly gives Hunter the ability to test free agency rather than be forced to linger on a roster until the summer since it is a “pay me or cut me” decision date, the fact is Minnesota was almost always going to be in that position.

The Vikings have, historically, done extensions from their veterans with two years left on their contracts. Everson Griffen, Linval Joseph, and Adam Thielen all received that treatment. Given that there was almost no way for the Vikings to wait out a decision beyond next year. They had an unhappy player on their hands already and if they refused next year after setting precedent with these others it was going to be a bad situation. So the Vikings were always going to have to make a decision about extending Hunter next year.

If Hunter played poorly this year he would have been cut or asked to take a pay cut. If he played well they were going to extend him. None of that changes because of an $18 million roster bonus.  Their decision matrix remains unchanged meaning they gave up next to nothing to get a player back happy with the organization.

As for the cap charges I also would not be concerned. I look at the $18M bonus as nothing more than a placeholder. My assumption is the Vikings will have the right to convert that to a signing bonus and may have added void years to help. The $5.6M signing bonus is an odd number if you divide it by 3, which is the remaining term of the contract. While some teams still do bonuses like that from time to time more often than not they choose bonus amounts that are neat and clean when prorated. $1.866 is not clean. However $1.4 million over 4 years and $1.12 million over 5 years are. So that is why I would guess that there are void years.

In any event they should be able to split that $18M up as $9M over two years as a worst case scenario which would probably put his cap number around $17.9M ($2M salary, $9M RB Proration, $5M SB1 and 2 proration, $1.87M SB proration). Currently its $17.75M so again no material change unless they don’t have the right to convert the roster bonus which certainly seem shortsighted if that were the case.

The new bonus is so small that it doesn’t add much more onto the cap charge if they cut him and if they don’t really do anything with the money except carry it over to next year that offsets that added cost if they release him next March.

Hunter didn’t really have any options here and the Vikings held most of the cards. I think this was a really good way for the team to handle this kind of situation. The player winds up happy even though the team’s position doesn’t change at all. Really a terrific job by Minnesota, assuming of course all the reported details are indeed correct.

What Teams Might Make Sense to Trade for Julio Jones?

More and more talk is centered around Julio Jones these days and it would seem that the Falcons are intent on trading him, so I thought it might be worth a look at the teams that might be in the market for a wide receiver. Jones carries a $15.3 million salary cap charge for a team in a trade but that number could easily be taken down. With the use of void years, Jones’ cap charge could be as low as $3.92 million so while the salary cap should be an important situation I would not take it as a complete block on a trade.

Here is a look at how teams rosters stand right now based on the performance of their top 3 receivers last season.  The X axis is the total routes run by those top 3 players in 2020 and the Y axis is the average PFF receiving grade of those top 3 receivers. The top 3 were determined by routes run and would not include any draft picks from this year. The bubble size represents the cap space the teams have remaining.

The teams with the biggest needs should come in the lower quadrants where they have sub performing receivers. From looking at the chart I would say that the most logical fits would be the Colts, Broncos, and 49ers with outside candidates of the Chargers and Football Team.

However, I think it is fair to say that any team trading for Jones should take a different look at things. The right way for them to look at this is to measure what impact Jones, assuming he is healthy, might have their group if he replaces the 3rd guy on the unit. Since it is a “win now” kind of move we also should not just be looking at 2021 cap room but also 2022 cap room since basically a team can take the $15.3 million across two years and trade or cut Jones if they wanted to in 2022.

If we assume 520 routes for Jones this year this is how the teams would move. The size of the bubble now represents the cap space a team would have in 2022 after paying Jones $15.3 million and deferring the cost over two years. The bubbles with a silverish color represent teams that would be over the cap in 2022.

Almost every team in the NFL moves into the dominant WR corps. quadrant by trading for Jones and adding him to the mix. This table provides the increase in snaps and average grade that each team will see by adding Jones to the mix. The column that I think is the most interesting is the dollars spent to get that average increase.

TeamTop 3 SnapsTop 3 GradeSnaps GainedGrade IncreaseSnap Increase% Grade Increase% Snap Increase2022 Cap Space$/Grade Increase
Seahawks1,77881.629710.3729714.6%20.1%$39,929,203$1,475,884
Lions1,10671.340110.2340116.7%56.9%$22,946,217$1,495,114
Bengals1,52779.837710.1337714.5%32.8%$61,393,713$1,509,868
Broncos1,46875.11949.8319415.1%15.3%$62,290,154$1,555,932
Vikings1,54487.83008.2030010.3%24.1%$13,226,028$1,865,854
Ravens1,30772.42608.0726012.5%24.8%$30,835,613$1,896,694
Washington1,55879.51287.9312811.1%9.0%$55,448,008$1,928,571
Colts1,42375.11537.4315311.0%12.1%$72,626,534$2,058,296
Bears1,65080.2517.20529.9%3.2%$29,679,005$2,125,000
Titans1,41880.43427.203429.8%31.8%$12,750,283$2,125,000
Eagles1,38171.52166.9021610.7%18.6%$8,556,532$2,217,391
Cardinals1,66078.586.40108.9%0.6%$10,749,491$2,390,625
49ers1,18476.23416.333419.1%40.5%$5,660,393$2,415,789
Buccaneers1,51580.32106.232108.4%16.1%$7,924,717$2,454,545
Panthers1,60680.02185.802187.8%15.7%$52,902,772$2,637,931
Rams1,61977.93665.603667.7%29.2%($18,728,109)$2,732,143
Packers1,44978.62615.532617.6%22.0%($42,364,873)$2,765,060
Chiefs1,60076.71795.071797.1%12.6%$2,585,870$3,019,737
Saints1,12676.33755.033757.1%49.9%($20,331,038)$3,039,735
Raiders1,23771.82334.772337.1%23.2%$32,471,630$3,209,790
Dolphins1,35982.32854.632856.0%26.5%$60,012,383$3,302,158
Jaguars1,61777.11324.371326.0%8.9%$65,581,663$3,503,817
Chargers1,62173.7354.20356.0%2.2%$55,702,132$3,642,857
Texans1,38677.92524.172525.7%22.2%($11,887,574)$3,672,000
Cowboys1,76876.544.1065.7%0.3%($26,182,491)$3,731,707
Browns1,21380.93423.733424.8%39.3%$16,100,903$4,098,214
Steelers1,68673.9832.93834.1%5.2%$63,101,540$5,215,909
Giants1,43977.23831.703832.3%36.3%($8,128,068)$9,000,000
Patriots1,40777.21951.601952.1%16.1%$24,968,124$9,562,500
Falcons1,37581.100.0000.0%0.0%$3,778,215
Bills1,59480.459-0.4759-0.6%3.8%($3,037,723)
Jets1,48674.9139-0.77139-1.0%10.3%$83,761,423

When looking at it this way I think I would change the mix. Seattle absolutely should be in on Jones this year. Though they do not have the cap room this year they clearly have the two year room needed to do this. Seattle is a win now team and it would close any receiver questions they have to add a player like Jones. If it means not extending Jamal Adams so be it as they should be looking to win a title. The only question here is would the Seahawks move away from their love of the run if they added Jones?

The Broncos should remain a team to look at though they are expecting injury reinforcements that may make this artificially high. The Ravens would move way up by making a trade here. Now they have to worry about a Lamar Jackson extension but they already have $23 million on the cap for him in 2022 so an extension will lower that number.

I think based on this you could move the Bears and Titans into the mix too to go along with Washington and the Colts that I mentioned above. The Bears might have a really difficult time fitting him this year but if you are going for broke you can make a case at least for them. The Vikings would have a super unit but I don’t think they are going anywhere at this stage with Kirk Cousins and might not use him enough to justify it. They would have to philosophically make a major change though it would be an interesting mix if they did.

The teams not expected to win now such as the Lions should not be considered since this is a short term rather than long term boost. Those with little cap room also should be out. The Packers, Cowboys, Saints, Rams, Texans, Giants, and Bills have no business being involved. Likewise you should question the Chiefs, Bucs, or Eagles from being involved. The 49ers are the only limited cap team that might still consider it only because they have a high priced QB who wont be on the roster in 2022.

It is worth noting that a few of the teams here did not move as much as I thought. Looking closer it is because of some quirks in snap counts and I was too lazy to clean it up. The Jets for example have Keelan Cole as their top route runner but if they made a trade for Jones (they shouldn’t) Cole would be the guy bumped not Corey Davis. Of the teams impacted by this only the Chargers (Guyton remains rather than Mike Williams) would probably move and make sense as a destination.

You can argue with how you want to value a player. In this case a grade was easy to use but we could use OTC values, yards per game, increase in catch rate, productive yards and so on but identifying the cost per some impact metric is important in helping with a trade or signing decision. And in cases like this sometimes looking just at 2021 cap room might not be the best way to look at a move for a high impact type of player.

Players Beginning to Opt Out of Workouts

In something has probably been some time coming NFL players are beginning to collectively opt out of their offseason workout programs. Thus far today the Broncos and Seahawks have said they will not attend the offseason programs and I would expect many more to follow suit.

The concept of the workout program has always been something that was very hit or miss with veteran players. It is often a trivial amount of money relative to the NFL contract for attendance in an offseason program. To encourage participation teams devised the contract mechanism called a workout bonus in which a player was paid a reasonable sum of money for attending most of the offseason program.

Through the years, however, teams started to seemingly get good participation regardless of offseason money and they used them less and less in their contracts. Those who did keep them never really adjusted with the times as salaries increased workout bonuses stayed pretty much the same- anywhere from $100,000 to $500,000 for the biggest players and $25,000 to $75,000 for the others.

The question is what will the NFL’s reaction be to this. My guess would be that they will up the amount of money that is tied to workouts similar to what was done in the past. While I don’t think teams see the value in the workout program the way they used to they clearly like having the players around the facility during the offseason. Workouts are also beneficial to the non veteran who is more of a fringe player. He can often use more time with the staff and getting prep work for the season. Those players are the ones who have probably been hurt the most by reductions in non gameday related activities over the years.

Overall we have a record of 212 players with a workout bonus with the largest being $750,000 (Za’Darius Smith). 16 players have a bonus of at least $500,000 and 102 between $100,000 and $500,000. The remainder have under $100,000 tied to workouts. If you do not have a contracted bonus for workouts you will earn $275 for each day you attend.

It is also important to know that sometimes workout participation is tied to other salary in your contract. Teams such as the Cowboys, Texans, and Football Team often have what are called workout de-escalators that reduce a players in season salary if they fail to attend the workout program. Usually these range from $250,000 to $500,000 per player and apply to every veteran with a major contract. These teams often have no workout bonuses but the salary tied to the workout is actually among the highest in the NFL. Sometimes teams will also have fine print language tying a portion of a bonus to offseason participation.

Of actual workout bonuses we have records of 25 teams that utilize them this year. Here is the list.

TeamPlayersTotalAvg./Player
Packers19$5,065,000$266,579
Jaguars24$3,725,000$155,208
Bills28$3,172,500$113,304
Chiefs25$3,053,000$122,120
Panthers7$1,925,000$275,000
Bengals8$1,900,000$237,500
Raiders9$1,830,000$203,333
Bears11$1,225,000$111,364
49ers6$1,050,000$175,000
Patriots10$1,040,000$104,000
Vikings11$981,250$89,205
Broncos4$750,000$187,500
Browns6$600,000$100,000
Dolphins13$550,000$42,308
Rams1$500,000$500,000
Giants8$480,000$60,000
Saints4$400,000$100,000
Eagles6$360,000$60,000
Lions3$280,000$93,333
Cowboys1$180,000$180,000
Texans4$115,000$28,750
Seahawks1$100,000$100,000
Cardinals1$50,000$50,000
Football Team1$50,000$50,000
Chargers1$25,000$25,000

How Teams Are Using The Signing Bonus to Manage the Salary Cap

This year brought about a lot more use of signing bonuses than usual, but this has been a method of managing the salary cap that teams have used for years. To try to put the numbers a little more into context I wanted to look at how leveraged teams are with the use of the signing bonus. To do that I looked at how much salary teams have on the books from 2022 to 2026 that is not prorated and compared it to the amount that is prorated. The reason for the 2026 timeframe is because that is the final year that any prorated money is currently on the books for.

The Biggest Abusers

Eagles- 40.7%

The Eagles are well known for their use of bonus restructures to deal with the salary cap and deferring millions of dollars to the future. They rank 2nd in the NFL with $151M in future charges related to signing bonus prorations which is incredibly high when you consider they don’t have a QB on a veteran multi year contract. With just $221M in other salary to account for the Eagles are pretty much going to be in a pinch whenever they need to cut a player or a void hits the books. The Eagles have around $60M in prorated void money over the next five years by far the most in the NFL.

Steelers- 37.5%

I would feel confident in saying that the Steelers pledge more signing bonus money at signing than any team in the NFL, but they have also heavily relied on restructures. They had been able to keep things somewhat in check, though, by avoiding the use of voidable contract years on their restructures until 2021. The Steelers were hit hard by the decline in the cap to the point where they needed to use void years for even low level signings. The team has about $97 million remaining in non prorated salary and $57 million in prorated salary that is sunk. $20 million of that number comes due next year if the first set of voids kicks in, the highest void total in the NFL.

Falcons- 37.1%

The Falcons have made a mess of their salary cap the last few years in an effort to keep signing players but they have still more or less avoided the use of void years (their recent restructure of Dante Fowler’s contract is a void year without calling it that) which is a positive. They have gone heavy into their stars which makes trading their players or cutting them difficult. In a sense they remind me a little of the Lions in the “big 3” era where the team hurt themselves by going to the well too many times on just a handful of players.

Saints- 35.5%

The Saints attempts to skirt the salary cap for the last five years is well documented. They have used almost every trick available to push salary out, second only to the Eagles in the use of restructures and void years. Their ratio is technically a little better than this because technically Drew Brees is still on the roster in 2022 due to a void and he will be released prior to that but that is just shuffling the money from potential dead money to actual dead money once they process his retirement on June 2.

Seahawks- 31.9%(Does not include Lockett extension)

I didn’t expect to see Seattle here but they used a massive signing bonus with Russell Wilson and really played their cap haphazardly the last two years on a relatively lower cost team. They had to go in and do a few conversions this year and used void years in almost every signing. They are shorter term voids compared to other teams but that still pushed them over the top.

The other teams that are over 30% are the Buccaneers (a complete departure that all happened this offseason), Panthers, Cardinals, and Packers.

The Non-Users

Colts- 4.3%

Indianapolis has taken over the Buccaneers historical position of being allergic to the use of the bonus for cap relief. The 4.3% is basically all due to rookie contracts where teams do not have much of a choice because of the expectation of paying rookies a big chunk of change in their first year in the NFL. Their $10.5 million of prorated bonus money is about $15 million less than the next closest team giving the team great flexibility for the future to handle roster turnover that occurs in the NFL.

Jets- 12.1%

The Jets have done a complete 180 in regards to contracts over the last two years going from a bonus heavy team that has dealt with awful cap consequences to one that is hardly using them. The Jets signed two big ticket players this year and barely used a signing bonus in doing the deals. With a rookie QB about to come in and no major extensions in sight the Jets should be able to hammer home this concept if this is their new strategy they want to go with as a way to manage the salary cap.

Dolphins- 15.7%

Miami went through some bad salary cap times not that long ago and have adjusted accordingly by moving away from the messes that were the Ndamukong Suh and Ryan Tannehill style deals and instead doing a more focused approach to the contracts. They are not as low as the Jets but have been cautious with the signing bonus on their recent signings using numbers of $10.5 million for Byron Jones and $7 million for Xavien Howard. I would lean toward Miami having one of the more balanced approaches to maximizing salary cap space in the present without abusing the future.

Chiefs- 16.0%

The number for Kansas City is a bit misleading. Their $86 million in prorated money ranks 14th in the NFL but their ability to avoid ridiculous sums of bonuses on Patrick Mahomes drives their percentage way down since his contract is so large. I would not expect this to change much in the future unless the Chiefs have to restructure Mahomes in 2023 and 2024. That contract really gives the Chiefs so much leeway with the cap. It’s really the most team friendly contract in the NFL all things considered.

Titans- 16.4%

Tennessee has always done a fair job of managing their contracts and finding a good balance between bonuses and non-bonuses. They have a few big money deals on the books now and are continuing that approach which can be difficult to do. I would be interested in seeing what happens to Tennessee if they have another year where they are a 2nd round type playoff exit and if that leads them to move in a different direction ala the Bucs in an attempt to really just go for it with this group of players.

Here are the numbers for all the teams in the league.

TeamYearly SalarySunk Salary% Sunk
Eagles$221,695,054$151,066,98640.5%
Steelers$96,194,531$57,703,62037.5%
Falcons$175,727,906$103,653,76837.1%
Saints$263,020,952$144,796,13535.5%
Seahawks$137,070,805$64,109,10531.9%
Buccaneers$214,601,283$96,014,07430.9%
Panthers$157,371,584$68,537,22630.3%
Cardinals$204,418,281$88,783,80330.3%
Packers$275,063,199$119,166,84430.2%
Ravens$230,061,184$94,915,12029.2%
Browns$252,470,918$104,038,46529.2%
Bears$244,098,101$100,563,49029.2%
Giants$233,124,304$86,894,75027.2%
Cowboys$457,861,192$155,276,02125.3%
Football Team$193,598,864$65,488,05725.3%
Vikings$245,483,047$81,369,17224.9%
Patriots$243,468,949$79,117,32224.5%
Lions$269,116,797$85,917,93124.2%
Bengals$199,704,576$62,819,99023.9%
49ers$329,296,653$100,809,32023.4%
Broncos$230,815,181$65,149,78722.0%
Jaguars$228,001,295$63,629,45121.8%
Raiders$126,098,324$35,117,74521.8%
Bills$244,391,604$67,897,18721.7%
Rams$372,769,720$93,692,08320.1%
Chargers$283,907,330$68,942,76119.5%
Texans$314,213,980$68,833,81318.0%
Titans$281,692,763$55,239,60616.4%
Chiefs$450,802,814$86,159,95416.0%
Dolphins$239,477,089$44,682,15315.7%
Jets$187,604,801$25,733,91312.1%
Colts$237,476,216$10,553,9944.3%
NFL Avg.$245,021,853$81,146,05125.0%

A Look at Franchise Tags from 2011-2020

As the NFL heads into the offseason, a key date on the league calendar is February 23rd and March 9th, the window in which teams can utilize either the franchise or transition tag. As we get closer to the date, I wanted to take a look at the historic usage of tags between 2011-2020:

  • Teams have used the franchise or transition tag 99 times
  • 55 of the 99 (55%) players tagged did NOT reach a long-term extension with their incumbent team, prior to the deadline to sign tagged players to extensions
  • Le’Veon Bell, Kirk Cousins, and Dak Prescott are the only 3 of the 99 players tagged who have received the “exclusive” designation
  • Teams that have applied the tag the most are the Chiefs (7), Cowboys (6), and Steelers/Dolphins/Broncos/WFT (5)
  • Teams that have applied the tag the fewest are the Packers (0), Texans/Seahawks (1), and Eagles/Lions/Raiders/Titans/Falcons/49ers/Saints/Vikings/Bills/Buccaners (2)
  • Positional groups seeing the most tags are Linebackers (18), Defensive Ends (15) and Kickers (10)
  • Positional groups seeing the fewest tags are Cornerbacks (5), Tight Ends (5), and Punters (2)

The graph below illustrates the usage of tags by year, with last year seeing the most tags since 2012.

If the salary cap is set to the widely reported figure of $180.5M, the franchise tag numbers for 2021 would be as projected below. 

The table below compares the 2021 projected franchise tag numbers with last year’s tag numbers.           

Position2021 Projected2020% Change
QB$24.828M$26.824M-7.44%
WR$15.808M$17.865M-11.50%
DE$14.530M$17.788M-18.31%
CB$14.895M$16.338M-8.83%
DT$13.736M$16.126M-14.82%
LB$14.630M$15.828M-7.57%
OL$13.602M$14.781M-7.98%
S$10.496M$11.441M-8.26%
TE$8.496M$10.607M-19.90%
RB$8.074M$10.278M-21.44%
K/P$4.433M$5.019M-11.67%

 A silver lining that teams may recognize from the expected salary cap decline is the discounted rate of franchise tags this season. For example, working off the 2021 projected tag numbers, it would only cost the Packers around $8M to tag Aaron Jones. While the Packers are currently $19M over the cap, if they can manage to create enough capspace through restructures and cuts to take on a $8M cap charge for Jones, it would be excellent value. Jones has the production to earn a deal valued in the top 5 of the RB market and the salary for that point in the market starts at $12.5M. With the 2021 tag numbers dropping at least 7%, year over year, across the board, it would not be shocking to see more teams using the tag, than typically in years past.