In my article last week about Kirk Cousins, I used the metric of of yards per target as a way to evaluate the Redskins’ receivers.. Cousins’ NFL leading 69.8% completion percentage increased the effectiveness of their short passing game and led to 7.3 yards per attempt, which was seventh in the NFL.
Pierre Garcon and Jamison Crowder give the Redskins’ the possession receivers who give them seven to eight and a half yards per target, then tight end Jordan Reed at 8.35 per target. Desean Jackson had 10.8 yards per target in an injury shortened 2015 after leading all wide receivers with 12.3 YPT in 2014 according to Joe Dolan and Tom Brolley at FantasyGuru.com.
With that analysis, I realized that I could take my thoughts on yards per play and break it down even further into efficiency by player. Yards per catch is a flawed statistic as it doesn’t really tell us anything about efficiency and is kind of like batting average is in baseball in that it doesn’t account for another important outcome of batting: the walk. The reason baseball switched from the emphasis on batting average to on-base percentage is because the objective is to get on base and not use one of your 27 outs. Outs are like a diminishing resource, just like drives and plays are in football, so it’s important not to waste these as they’re finite.
From that Fantasy Guru data I found some important stats from 2014, which is the last data set available. The year to year numbers haven’t changed much, but the average catch rate of 64.5% for 2014 was 1.5% higher than 2013 and 3% higher than 2011. So the trend seems to be what I suspected: there’s a league-wide realization of the importance of increasing efficiency in the passing game. The league-wide trend like the shorter time to throw for quarterbacks around the league is showing this. Tom Brady for example has averaged 2.35 seconds in terms of time to throw this season with one of the best ball control offenses in the NFL. The total yards per target was 7.42 for 2014, which was about a tenth of a point over 2013. It gets more interesting when we break things down by wide receivers, tight ends and running backs. These data sets include wide receiver with at least 40 targets, tight ends with at least 20 and running backs with at least 15.
First off, wide receivers had a catch rate of 60.8% with 13.1 yards per catch and 7.95 yards per target. The catch rate was the lowest, while the YPC and YPT were the highest, of the three groups.
Next, tight ends had a catch rate of 64.5% with 11.0 yards per catch and 7.32 yards per target. While there are various different styles of receivers like the Antonio Brown versus the Calvin Johnson prototypes, tight ends lack that diversity. We know that tight ends are known as a bit of a “safety valve” for their quarterbacks and they’re not consistently running the deeper routes that a Calvin Johnson or Julio Jones run, so it makes sense that their catch rate would be higher as a group. I think that the yards per target just 0.63 below the wide receiver group, with the 3.7% increase in completion percentage, illustrates a bit of the efficiency I’m talking about.
Lastly, the running backs of 2014 had a catch rate of 73.7% with 8.1 yards per catch and 5.94 yards per target, which shows the stark difference between the kinds of routes that this group runs in comparison to the other two and, subsequently, their role in the offense.
My foray into researching yards per target came from a note I had taken back in Week 2 this season regarding Julio Jones as he already had 22 catches on 26 targets in two games. His role in their offense was almost like in basketball where you’ll hear people refer to their offense as being “run through” a specific player. That example made me realize that we need a better measuring stick for judging pass catchers, so we can judge them as we do running backs with yards per carry.
Below are the top 40 receiving yards leaders for 2015:
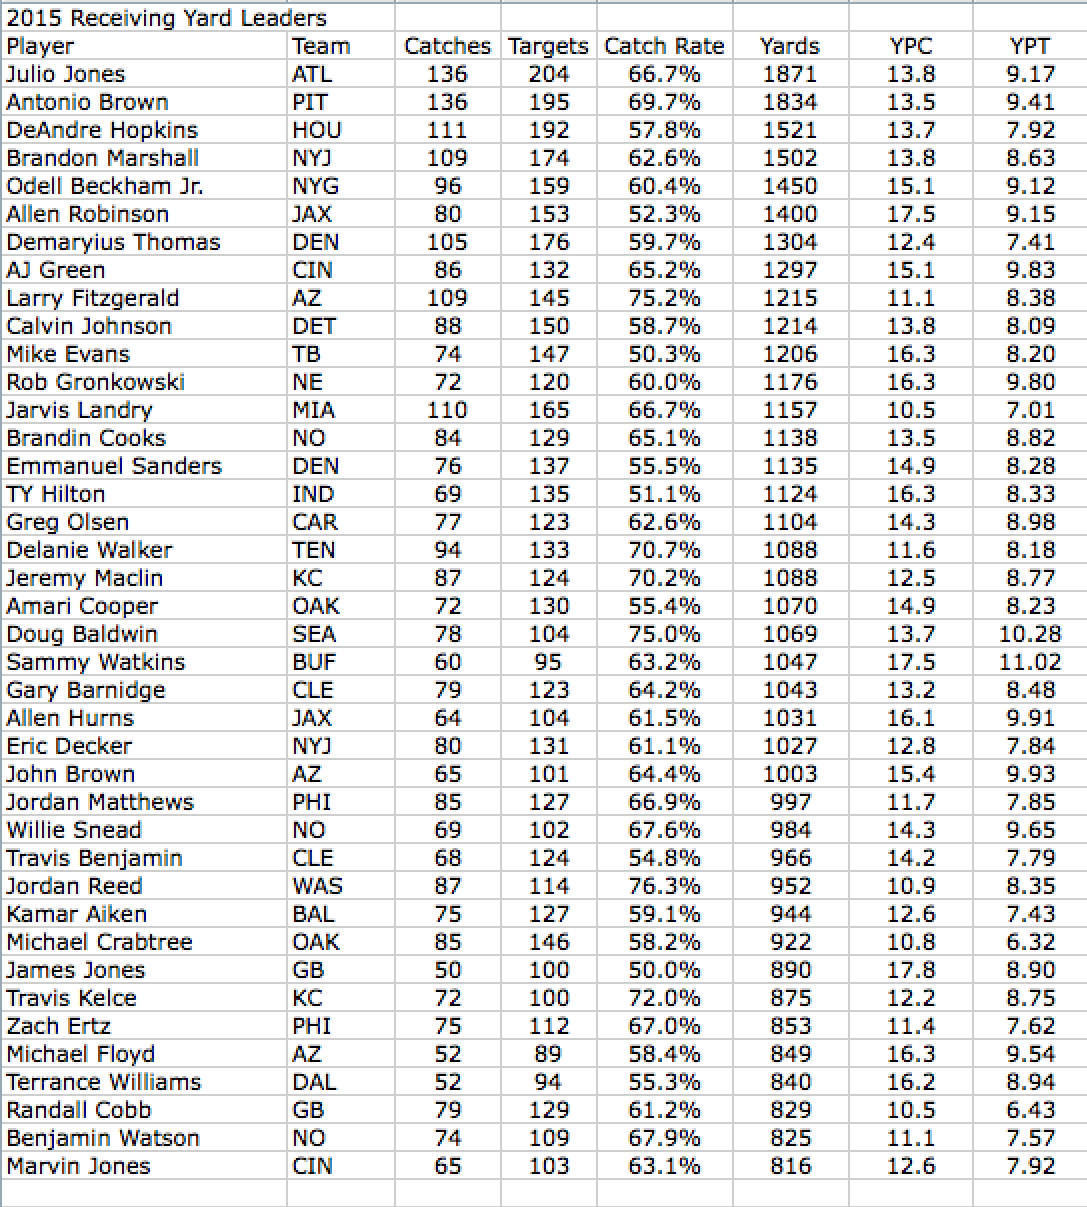
It’s worth noting that the average for this group was a 62.6% catch rate, 13.8 yards per catch and 8.56 yards per target.
You see numbers like DeAndre Hopkins and, right away, you see the influence of him playing with four different average quarterbacks with his 7.92 yards per target so far below the guys around him on this list. Same goes for Demaryius Thomas in the worst season of Manning’s career.
With Jordy Nelson stretching the field for him last year, Randall Cobb had a YPT of 10.13 to go along with Nelson’s 10.06, but he dropped all the way to 6.43 in 2015 with James Jones at 8.90. Those four numbers right there may summarize the difference in the Packers offense more than anything else. During Aaron Rodgers’ MVP campaign in 2014, the offense averaged 6.17 yards per play, while they dipped all the way to 5.07 in 2015. Eddie Lacy’s down season can’t take the blame either as the Packers still managed a solid 4.2 yards per carry, compared to 4.4 in 2014, as James Starks stepped up for the Packers.
Doug Baldwin’s 75.0% catch rate with 10.28 yards per target is like Wes Welker in terms of the efficiency the team experiences throwing him the ball, but a full yard better per target than Welker ever was, which is likely due to Baldwin being a bit more of a deep threat combined with the big pass plays that result from Russell Wilson and their scramble drills. With Baldwin and Tyler Lockett, the Seahawks have a duo of efficiency that might be even better than what the Patriots have with Julian Edelman and Danny Amendola. In just his rookie season, Lockett had a catch rate of 73.9% for 9.6 yards per target on his 51 catches for 664 yards (13.0 ypc) and six touchdowns, which makes him a prime candidate to have a big season in 2016, when he’ll surely get more than 69 targets with that kind of performance. While he’s not in the same conversation as an Antonio Brown yet, it’s clear that he’s on the path to becoming that level of player if he stays healthy.
For the Patriots, Edelman had a catch rate of 69.3% with 7.85 YPT during his injury shortened nine game season and Amendola with 74.7% and 7.45 YPT in 14 games. When Keshawn Martin stepped in, he had a catch rate of 64.9% and 7.27 YPT. Even during his terrific 2014 season, Edelman’s 972 yards on 134 targets gave him 7.25 YPT.
The comparison between Baldwin and Lockett against Edelman and Amendola is a good illustration of why it’s difficult to judge based on just these stats because each offense is different. Welker’s best season, from a yards per target standpoint, was in 2011 when he had 9.1 with a catch rate of 70.5%. Welker’s 77.2% catch rate from 2007 was his highest performance for that stat, while his YPT was a full yard lower at 8.1. The yards per catch in 2007 and 2011 were 10.5 and 12.9, so maybe the higher YPT and lower catch rate was due to Welker running different and deeper routes without a true #1 receiver on that team. There are so many factors that weigh into these stats that must be taken into account before levying our own judgments on what they mean, so I’m sure this will be a topic of research and discussion in the coming months.
Both the Seahawks and Patriots have found value in these shorter, quicker receivers as they produce at a solid YPT level with catch rates above 70%, which means your offense can rely on seven or eight and a half yards per target, but hit on those targets seven out of ten times. It’s clear there’s a huge ball control advantage to having these players who can be relied on to consistently catch the ball and move the chains, yet they cost 3-5% of the cap, while their prototypical WR1 counterparts cost 7-10%. With the league trending towards quicker passes in response to the kind of pass rush we saw Denver display in the Super Bowl, it’s clear that there’s a market inefficiency here.
Coming from writing that Redskins article and seeing Garcon at 7.0 YPT and Crowder at 7.74, then seeing Jarvis Landry at 7.01, Eric Decker at 7.84, Jordan Matthews at 7.85, Travis Benjamin at 7.79 and Larry Fitzgerald at 8.38, I think that a solid slot receiver who runs those short to intermediate routes will end up in the seven to eight and a half yards per target neighborhood. Considering that Welker’s best season slipped just above nine yards per target during the year where he had to take on more of a WR1 role, while the rest of his career is in the range of eight yards per target, is a sign of that being true. The fact that Baldwin got all the way up to 10.28 yards per target for a short, quick guy who spends most of his time in the slot is a sign of how incredible his season was.
Allen Hurns and Decker ended the season with similar catch rates and total yards, but Hurns 9.91 YPT far outpaced Decker’s 7.84 and Allen Robinson gave the Jaguars 9.15 YPT as well give them two players with over 9.0 YPT, which is a sign of terrific production and efficiency. BUT, the Jaguars were lacking one thing that every good offense seems to need: the chain mover, the guy who gives you that 7-8.5 YPT. After spending big money on Julius Thomas, they were likely hoping he would be that guy for them as well as their big Redzone target, but in 12 games he only had 455 yards on 80 targets, so his 5.68 YPT sure wasn’t enough. Bryan Walters was their fourth leading receiver with 32 catches for 368 yards (11.5 ypc) on 45 targets for 8.18 YPT in 11 games, but that’s not enough in terms of the quantity.
Hurns and Robinson both gave them over 1000-receiving yards and 16.1 and 17.5 yards per reception respectively, but there was something missing for a Jaguars offense that was 20th in the NFL in first downs and 26th in third down conversion percentage. Their rushing offense was 27th in the NFL at only 92.1 yards per game, so that adds to the issue. They’re likely hoping that a combination of Marqise Lee, Rashad Greene or Walters help Thomas pick up the slack in 2016 because, if they do that and improve their running game, they’ll have an offense that has everything needed to move the ball and score.
Robinson also had a catch rate of 52.3%, which makes it more of a hit or miss proposition than a consistent action that can be relied upon to move the chains down the field. While he’s a phenomenal receiver, his hit or miss is indicative of what they’re attempting to do when they throw to him. It’s the opposite of investing with a conservative approach, a way that’s going to make you money consistently and march you down the field toward your retirement (insert John Hancock commercial here); it isn’t sexy, but if you can resist the temptation to screw around with it, you’ll be content.
The big, deep throw is like the more risky investment that you hope to get rich on, but could just as easily miss—and throw away one of those outs, or plays, which are finite. These aren’t the best retirement plans, but they give you the potential for a financial touchdown. In football, these risks result in big plays and touchdowns, two things that are obviously very important and enticing, but much less reliant than the conservative approach of using a slot receiver type to dink and dunk down the field. There is clearly a place for the deep ball and the Allen Robinson type receiver, but the investment that’s put into these prototypical WR1s since the Calvin Johnson deal is far higher than what the other receiver types cost. It all leads to a really interesting debate we can have regarding value through this prism.
In that Cousins article, I explained the relationship between the entire receiving group. The deep threat of Jackson creates space for the running game and the short to intermediate passing game. Jordan Reed provides a mismatch for the defense as he’s too fast for linebackers and too big for safeties. The guys like Garcon, Crowder, and Thompson give them pass catchers who can be relied on for 7-8 YPT; it’s clear to me that offenses need these kinds of players.
It’s sort of like the Jaguars being more like one of those 13 seed mid-majors in March Madness who can beat you with the three pointer, but don’t have the ball handlers or big men to make it too far, while the Redskins, and offenses like theirs, are more complete. While that three point shooting team can get hot and beat you, it’s the more complete team that has what it takes to make a more serious run at the title as they have the players who can match-up with any team and compete. Plus, the more complete team doesn’t have to rely on the lower-percentage three pointers.
As I wrote in that Cousins article and said on my podcast, the importance of the deep threat was made evident by the effect Desean Jackson had on the offense this season when he returned from injury as well as the struggles of the Packers without Nelson and the Eagles without Jackson or Jeremy Maclin. I believe that just like the measurables that teams use when acquiring players in terms of their size, speed, skill or other attributes, they should have a standard for the yards per target that they’re looking for out of each of the roles in their offense. Every coach and organization should know what their formula for winning is factoring in what they can expect from their offense, defense and special teams each week, so it should be broken down into concrete figures and expectations like any business would, all the way to the individual level.
I expand on this idea more on episode #4 of The Zack Moore Show over on iTunes and Soundcloud for those non-Apple users.
I think that YPT goes a long way to measuring the efficiency of all pass catchers as it incorporates actual yards per play and completion percentage into one statistic. After all, the idea is to catch the ball and move the chains to move towards the end zone and you can’t simply rely on big plays to get you there. Those who succeed best within this stat may be players who are more valuable than we think.
I look forward to your comments and ideas as they’ll help refine my thinking on the value of this stat.
@ZackMooreNFL
E-mail Caponomics@gmail.com to join the e-mail list for the Caponomics book coming soon as well as be updated when podcasts become available!