Examining NFL Draft Capital in 2019 & Looking Ahead to 2020

Follow me on Twitter @BradOTC

While we are still a few months away from the 2020 NFL Draft, I wanted to get started on some preliminary Draft content before we hit Free Agency.

Knowing the relative Draft Capital of each team will also assist in your understanding of how Free Agency plays out. Teams will look to improve their roster through both avenues separately, but a cohesive plan that takes financial and positional considerations into account is vital to success.

What do I mean by Draft Capital? Simply, the Total Value of all Draft Picks for each team. Where am I getting the values of each pick? The Jimmy Johnson, Rich Hill and Jason Fitzgerald Draft Pick Value Charts.

Jimmy Johnson and Rich Hill effectively codified the NFL’s valuation of each draft pick based on previous draft pick trades (methodology explained here). Jason valued the draft picks based on the historical Second Contract outcomes of draft picks (methodology explained here). The Rich Hill rankings most closely resemble what NFL teams believe they have in Draft Capital. The Fitzgerald rankings most closely demonstrate what teams truly have in Draft Capital.

Here are Jimmy Johnson’s Chart Values:

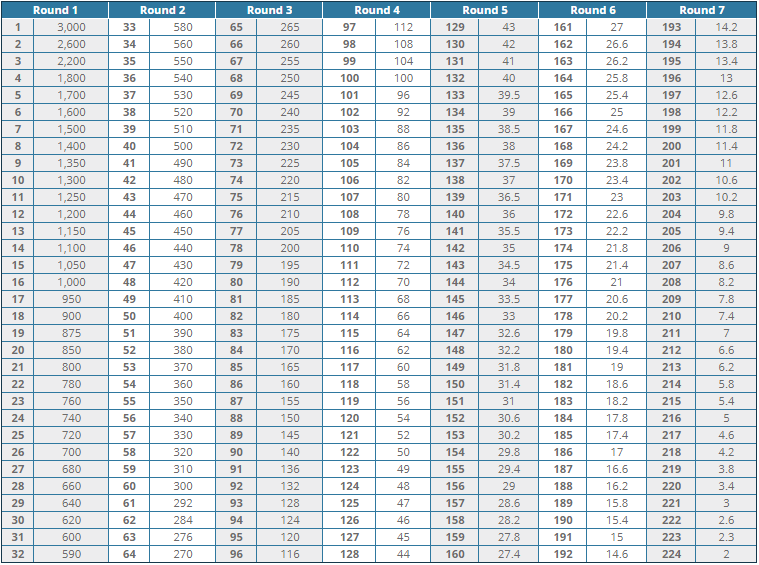
Here are Rich Hill’s Chart Values:

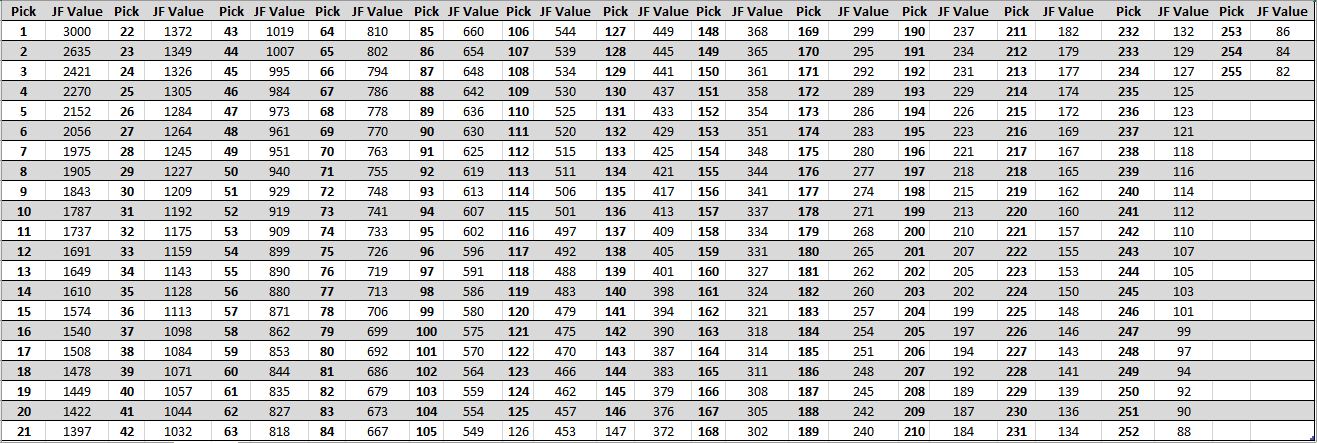
Finally, here is the Jason Fitzgerald Draft Value Chart:

Let’s look at the Arizona Cardinals as an example. The Arizona Cardinals have the No. 8, No. 40, No. 72, No. 111, No. 153, and No. 222 Draft picks for 2020. You can find their Total Draft Capital by simply adding up the Values associated with those draft picks for each chart.

According to the Jimmy Johnson chart, Arizona has a Draft Capital of 2235 points. According to Rich Hill, Arizona has a Draft Capital of 662 points. Finally, according to Jason Fitzgerald’s chart, Arizona has a Draft Capital of 4736 points.

But what do these random numbers tell us? Not much without context. One way to make Draft Capital more approachable is to look at the Value as a percent of the Total Draft Pick Pool.

With 32 teams, an exactly equal distribution of all 256 Draft Picks would come out to 3.125% of the Draft Pick Pool per team. For the Jimmy Johnson chart, 2235 points is 3.68% of the Total Draft Pick Pool. So according to Jimmy Johnson, Arizona has slightly more Draft Capital than the average team. For Rich Hill, that percentage decreases slightly to 3.6%, but Arizona remains above average. Finally, for Jason Fitzgerald, that percentage moves across the 3.125% line to 3.09%. Jason’s chart believes Arizona has less Draft Capital than the standard average.

This approach still has its limitations, as each Draft is different. To take it one step further, how Arizona’s Draft Capital stacks up against the other teams in the league is the truly critical information.

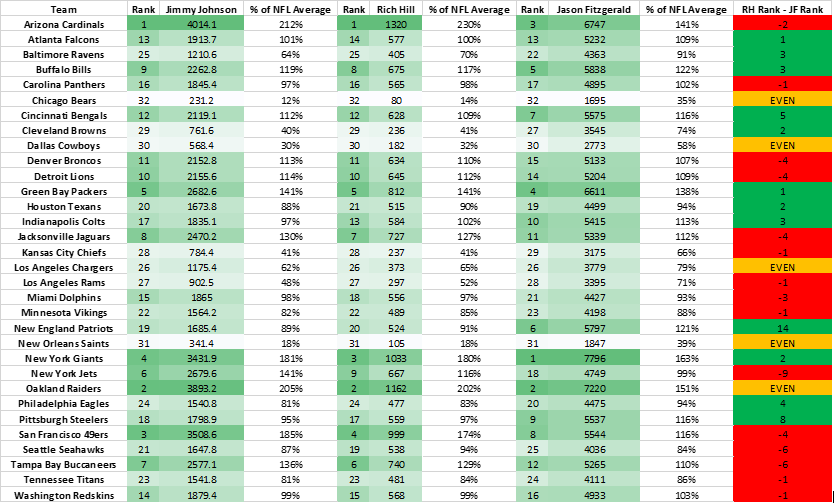
The below table illustrates the 2020 Draft Capital for every team according to Jimmy Johnson, Rich Hill, and Jason Fitzgerald’s Draft Value Charts. The far right column shows the difference in perceived value between Rich Hill and Jason Fitzgerald.

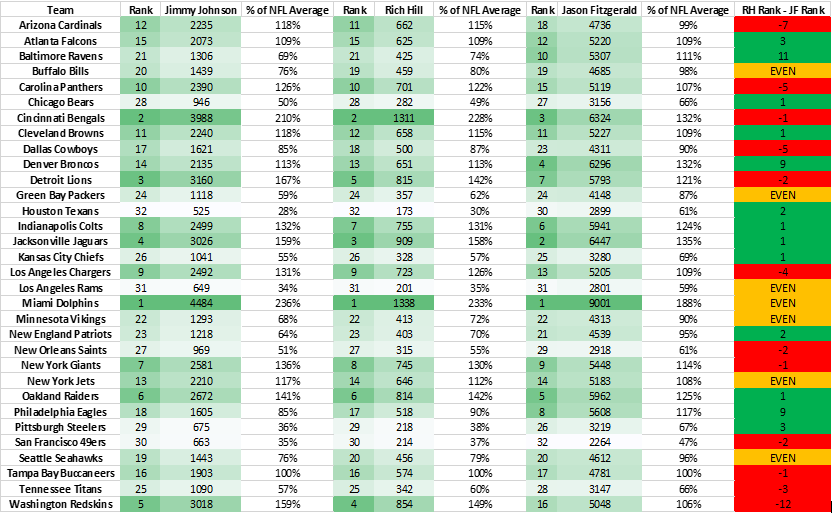
The above chart shows the 2020 Draft Capital for every team, including our Compensatory Pick guru Nick Korte’s projected compensatory picks for 2020.

Based on our analysis of every draft pick trade from 2011-2019, the Rich Hill Values most closely resemble what NFL teams are currently using to facilitate draft pick trades. The biggest disparities between Rich Hill’s chart and Jason Fitzgerald’s chart can largely be explained by the NFL overvaluing top draft picks and greatly undervaluing second and third round picks.

The Ravens (+11), Broncos (+9) and Eagles (+9) being the three teams that the Fitzgerald Chart valued the most as compared to the Rich Hill Chart is entirely unsurprising. The Ravens have earned the most compensatory picks of any franchise in the NFL since compensatory picks were created, and they trade down very often. The Broncos traded down from No. 10 to No. 20 with the Steelers just last year in a great trade for Denver in which they added a 2020 3rd Round pick. And the Eagles have embraced analytical decision-making in all facets of football as much or more than any other NFL team.

So what can we do with this information? Let’s take a look at 2019 Draft Capital before the Draft began…

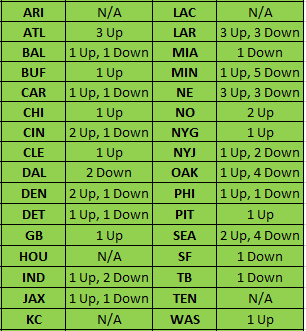
There were 37 “draft pick trades” (exclusively draft picks exchanging hands) during the 2019 NFL Draft. Another very unsurprising development: smart teams trade down a lot. It is no coincidence that the teams that traded down three or more times in 2019 were: the LA Rams, Minnesota Vikings, New England Patriots, Oakland Raiders and Seattle Seahawks. Now I know one of these is not like the other, but the Raiders maneuvered around the 2019 Draft exceptionally well.

2019 NFL Draft Trades by Team

These trades obviously occurred all throughout the draft, and the amount of value exchanging hands for a trade in the 1st Round is a lot different than one in the 6th Round. Here is the breakdown of the Draft Value that teams Gained or Lost:

As noted before, these Values don’t mean much in a vacuum. So, I converted the values back into the respective Draft Pick they equate to on each chart. For example, as you can see above the Atlanta Falcons Lost 648 points with their 3 Trade-Ups according to the Jason Fitzgerald chart. 648 points on the Fitzgerald chart equates to the No. 87 overall pick. The Rich Hill chart has the Falcons Loss at 9 points, which equates to pick No. 164. In contrast, the Jimmy Johnson chart has the Falcons Gain 30.6 points, which equates to the No. 151 pick.

Here is the same 2019 Draft Pick Trade Summary chart as above, except with the Values as Draft Picks:

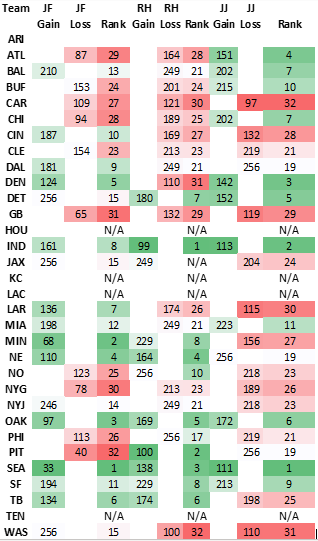
The Falcons example perfectly demonstrates the dangers of relying on the Jimmy Johnson Draft Pick Chart, which teams still appear to consult to varying degrees based on analysis of Draft Pick trades from 2011-2019. Calculating these Gains & Losses using the Values derived from Fitzgerald’s research of the historical outcomes of Draft Picks, the Falcons gave up a 3rd Round pick in Total Draft Capital through moving up three times. Calculating these Gains & Losses using an arbitrary point system with no known connection to data, the Falcons ADDED a 5th Round pick in Total Draft Capital according to the Jimmy Johnson chart. This disconnect can create tremendous value opportunities for smart teams, and it already has for some. Even when comparing Gains & Losses with the Rich Hill Chart (an update & improvement of the Jimmy Johnson Chart) there are still some large gaps in valuation.

The Falcons didn’t give up the most value according to the Fitzgerald chart though. That honor was reserved for the Pittsburgh Steelers, who made the biggest Trade-Up of 2019 from No. 20 (+ No. 52, + a 2020 3rd) to No. 10 to select Devin Bush. As you can see above, the Steelers clearly must at least look at the Jimmy Johnson Draft Value chart. I say this because according to the Jimmy Johnson chart, the Steelers and Broncos made a trade that was exactly equal in value for both parties. This is extremely rare for trades in the first two or three rounds. However, Jason Fitzgerald’s data tells us the Steelers gave up value equivalent to the No. 40 overall pick with the package they sent to Denver to move to No. 10. Rich Hill’s chart goes even further and actually tells the Steelers they won the trade and added value equivalent to the No. 100 overall pick. Imagine two NFL Draft war rooms wherein both teams thought they made out like absolute bandits in a trade. That is often the reality! The Jimmy Johnson & Rich Hill charts severely over-inflate the value of top picks and even more severely undervalue second and third round picks. That’s exactly what happened here.

One final component on display with the Steelers & Broncos trade that explains the large disparity: the future pick the Steelers included, a 2020 3rd. The analysis of trades from 2011-2019 seemed to confirm a long-held belief about perceived value in NFL Draft trades. The notion that when teams trade a future draft pick in the following year, they devalue the future pick by one round. For example, the 2020 3rd in this trade was treated as a mid-4th Round pick (No. 112) for the purposes of running this trade through the Johnson and/or Hill calculator to get as close to equal value as possible.

This methodology of devaluing future picks to the middle of the following round (No. 48, No. 80, No. 112, No. 144, No. 176, No. 208, No. 240) is imperfect for a few reasons, but still provided consistent results throughout the sample. First, teams don’t know if they will win the Super Bowl or have the No. 1 overall pick any given year (some may have better ideas than others over a stretch, but parity is real in the NFL). Second, compensatory picks make the length of the 3rd-7th Rounds different every year (Supplemental Draft pick usage can take a pick away from a team as well). Nevertheless, the Johnson and Hill charts have a much steeper decline in Draft Pick Value after the 1st Round than the Fitzgerald chart.

The “Rank” columns above really drive the point home: Jason Fitzgerald’s chart shows the Steelers gave up the most Draft Capital of anyone in 2019 through their big trade-up. Meanwhile, the Rich Hill chart tells the Steelers they added the second-most Draft Capital in the league. In their defense, and to play Devils Advocate a bit, if all of the other teams use the Jimmy Johnson and/or Rich Hill chart too then this isn’t that cut and dry. However, we know that the Fitzgerald Draft Values are based on actual data and are thus far more informative and predictive. For those that are fans of the Chase Stuart AV Draft Pick Value chart using Pro Football Reference’s Approximate Value metric, the Fitzgerald chart and Stuart chart are very similar.

On the opposite end of the spectrum, the Seahawks effectively added another 1st Round pick (No. 33 overall) with their series of Trade-Downs. The Seahawks traded back from their first spot of the night, No. 21 overall, and kept moving back to stockpile picks. Here is where every team started the Draft in terms of Draft Capital and where they stood by the end:

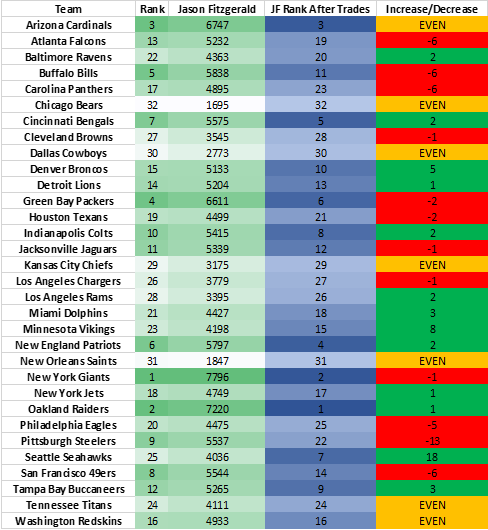
Future draft picks that were not accounted for in the Draft Capital before the Draft began were of course introduced, which makes this chart imperfect. But there aren’t many high priced future draft picks (especially when you devalue them all by a round) exchanging hands in a given Draft, so the impact is not too large. The Seahawks started the Draft with the 25th-most Draft Capital according to Jason Fitzgerald and ended it with the 7th-most, and they didn’t acquire any future picks. So within the 2019 Draft itself, the Seahawks were able to go from the bottom-third to the top-third in Draft Capital. How do you have a winning record for eight straight seasons? Well, there’s part of your answer.

I will be updating the 2020 Draft Capital as trades unfold throughout the offseason until the NFL Draft on April 23rd.

By: Brad Spielberger (@BradOTC)

The Atlanta Falcons Prepare to Enter Salary Cap Hell in 2020

As the Falcons fell to 1-6 with the 37-10 loss to a Rams team that was on a three game skid, I was inspired to turn towards 2020 to look at how this Falcons team and their terrible defense can potentially make a change.

Currently, they’re slated to be $8.7 million over the cap and largely because of some massive investments at the top of their salary cap. And that’s before you take into account the $9.6 million team is currently projected to spend on their 2020 draft picks.

Matt Ryan and Julio Jones will consume 27% of their cap in 2020. Steve Young and Jerry Rice set the Super Bowl record for a champion’s Top 2 cap expenses at 21.84% in 1994. Young’s cap hit of 13.1% is the highest cap hit for any Super Bowl champion in the 25 seasons of the salary cap era.

An astute 49ers organization re-signed 17 players in December 1993 to avoid the cap, so they kind of cheated the cap. This makes Matt Ryan’s 16.8% cap hit, and the QB market rates in general, even more crazy.

If you add Jake Matthews, Grady Jarrett, and Desmond Trufant, the Falcons top 5 cap hits will consume 50.6% of the cap. The Super Bowl record was set by the 2002 Bucs. Warren Sapp, Brad Johnson, Simeon Rice, Derrick Brooks, and Jeff Christy combined for 38.4% of the cap.

If you add Alex Mack, Deion Jones, Devonta Freeman, Mohammad Sanu, and Ricardo Allen, the Falcons top 10 cap hits consume a shocking 73.6% of the cap.

The 2015 Broncos have the cap era record for champions in spending 62.3% of the cap on Peyton Manning, Demaryius Thomas, Ryan Clady, Von Miller, Demarcus Ware, Aqib Talib, Louis Vasquez, Emmanuel Sanders, and Chris Harris, Jr.

Demaryius Thomas’ cap hit of 9.2% is the record for wide receivers and #2 cap hits on champions. Jones’ cap hit of 10.2% will be a percentage point higher.

When you consider why the Falcons defense is so horrible, you can look towards the low-percentage situation they’ve put themselves in. They were heavily reliant on too many low-probability things working out for them.

For offensive skill players, Ryan, Jones, Freeman, and Sanu consume 35.8% of the cap. Add Matthews and Mack, the team has 49% invested in six veteran offensive players. The team spent a first round pick in 2018 on another receiver, Calvin Ridley. There is so much invested in this offense and it has impacted the defense.

Over the last two seasons, an organization that has known defense was a weakness since their Super Bowl loss to the Patriots, has invested three first round picks in offensive players over the last two years: Ridley, plus linemen Chris Lindstrom and Kaleb McGary.

In the five drafts since 2015, the team has only had 32 draft picks, that’s eight less than the league average. Eight less opportunities to draft defensive players and instead have to take a larger chance on an undrafted player.

The team has become fully committed to their strategy for success: pass for more production than anyone else. It’s a valid idea for a strategy for success, but we’ve already seen Drew Brees play out this 7-9 reality when his defenses were terrible from 2012 through 2016.

It feels like some tough decisions should have been made over the last couple years like recognizing the crazy investment totals in 2020 and the likely need to trade Julio Jones who wanted a new contract.

He’s having a good season by anyone’s standards, but before this week, he’s already a bad value for the team as he’s produced about $12 million in value versus his $22 million average per year. That’s $22 million number is based on the player Jones was in his late-20s, the end of a receivers prime years. It’s not based in the reality of who he will be in the future.

Trufant is producing $9.4 million in value below his contract value, so two big investments aren’t working out great. Add the rest of the group in though too. Jarrett, Mack, Allen, Ryan, Matthews, Freeman, and Deion Jones are all producing below their value. Sanu is the only player in the Top 10 producing more than his contract value.

This is just an unfortunate truth of NFL contracts. Most second contracts will be proven to be bad values by Jason’s standard because of the extremely undervalued prices of everyone who basically contributes at all while on a rookie contract.

What the organization seemed to fail to recognize in all of this is the value that Kyle Shanahan provided to the organization during that 2016 season. Ryan and Jones had similarly massive cap hits during that year, but because of that trademark Shanahan offense, he was able to pull out the most extreme value out of that offense. The defense was still poor, but Shanahan made their offense the NFL’s highest scoring, not just the most prolific at passing.

That offense was ranked fifth in rushing with Freeman and Tevin Coleman leading an attack that ran for 4.6 per carry, rather than the 3.8 it’s churning at this year. It’s no secret that the Shanahan offense is terrific.

Even with Shanahan though, this 2020 team would be in a lot of trouble. The issue with spending $146.7 million on your Top 10 is an over-reliance on accepting sub-optimal players on the rest of the roster due to costs. Atlanta already has $3 million in dead money costs next year with potentially more dead money charges to come considering the need to get under the cap next year.

If the salary cap is $200 million, the Falcons have $51 million, or just 25.5% of the cap, to spend on the 43 other roster spots. That’s just $1.19 million or 0.59% of the cap per player to invest.

The team currently has just 40 players under contract AND they’re already projected to be over by $18.3 million when factoring in draft picks!

After the Top 10 players, the team has 12 players making over $1 million. When factoring in those 12 players, the Top 22 cap hits for the Falcons consume all but $1.95 million of a $200 million cap.

So an NFL team has 53 players on a roster, the Falcons are spending $198.05 million on 22 players, plus dead money. This leaves the team with $1.95 million for 31 players, which leaves $62,903 per player.

If the team does a complete fire sale and moves on from Mack, Freeman, Sanu, Allen, Keanu Neal, and Allen Bailey, that saves $32.125 million, which brings that total to $34.075 million in cap space. That’s still just $1.1 million per player, which, especially considering all the talent they’d be ridding themselves of in that scenario, likely makes them one of the worst teams in the NFL next year.

I have no idea what the Falcons are going to do to right the ship right now and I don’t think they do either.

Welcome to salary cap hell. We’ve been waiting for you.

Zack Moore is a certified NFL agent, a writer for OverTheCap.com and OnnitGymMMA.com, as well as the author of “Caponomics: Building Super Bowl Champions,” a book that breaks down how Super Bowl champions are built in the NFL’s salary cap era and discusses how NFL front offices can best allocate resources to create successful teams.

You can follow him on Twitter at @ZackMooreNFL. You can subscribe to The Zack Moore Show podcast here.

A Closer Look at Julio Jones $71.25 Million Contract

The other day Julio Jones signed a massive $71.25 million contract that will make him the 2nd highest paid receiver in the NFL. It is a very strong contract for Jones who will have $47 million guaranteed early in 2016, $2 million more than Dez Bryant’s recent extension. Normally when we value contracts that are extended we look at “new money” which is the additional money added to the existing value of the contract. That provides us the best way to compare pure free agent style contracts with those of players who have years remaining. But Jones’ contract situation was unique which led to a “win-win” negotiation where the two sides probably have somewhat different valuations on the contract. Continue reading A Closer Look at Julio Jones $71.25 Million Contract »

The Falcons, Sam Baker, and Working With Bad Contracts…

[adsenseyu1]

I came across a topic on the Atlanta Falcons message board discussing options for Falc0ns injured tackle Sam Baker and thought  it would make for a decent topic about how to handle bad contracts.

The Baker contract was never a good one and also illustrates some of the shortcomings of the Falcons way of doing business in which they use multiple tiered prorated bonuses on big ticket players. When those players bust the fall is difficult. Though Baker does not have any guaranteed money left after this season, a standard release would cost the Falcons $1.9 million in cap room, with Baker’s cap number jumping from $7.3 to $9.2 million. That’s the danger of these deals as even though there is no guarantee there is limited benefit to release.  It is what we call a virtual or effective guarantee. When such players are encountered teams have limited options if their salary cap situation is tight enough that they can not absorb large amounts of dead money.

The option most would consider is the June 1 cut. The June 1 cut allows a team to release a player at the start of the League Year, but have the release treated as if he was cut after June for cap purposes. In this scenario Baker’s cap charge from March through June 1 would be $7.3 million, the same as if he is on the roster, and then on June 2 it drops to $2.8 million. Atlanta would then carry a $6.4 million cap charge in 2016.  They could also accomplish this by simply waiting until June to release him.

The problem with that scenario is that no salary cap benefit is realized until June. Though it may not be as popular an option, the better option is to approach Baker with a deep paycut that contains no guarantees.  Baker’s options at finding a job in the NFL again would be limited so he would have little choice but to accept unless he was convinced that he would not pass a physical and thus qualify for injury protection under the CBAif released (that amount is $1.1 million) .

[adsenseyu2]

What the team would do is reduce Baker’s salary to something like $1 million and give him a chance to earn another $1 million in roster bonuses for games active and perhaps another $500,000+ for playing time. Because Baker did not play in 2014 the only number that would count towards the cap is the $1 million base, a savings of $3.5 million in immediate cap room.

The other benefit to this contract is because you guaranteed nothing you can still release him and have the same cap charges that you would with the June 1 cut, except here you get the benefit of immediate cap space and seeing if he can still benefit your team in any manner on the field. Here is how the scenarios would play out:

DateJune 1 CutReworked ContractReworked/August Release
March Cap$7,300,000$3,800,000$3,800,000
June 2 Cap$2,800,000$3,800,000$3,800,000
August 1 Cap$2,800,000$3,800,000$2,800,000
2016 Cap$6,400,000$6,400,000$6,400,000

There is virtually no downside to the reworked contract. You may get something positive out of the player and if you don’t the most it will cost you is somewhere between $1 and $2 million in cap room (the figures depends on games he is active for).  The 2016 season remains the same in any scenario and you gain immediate cap flexibility in 2015.  So while it is early to be discussing next years roster moves, actual teams should already be looking ahead as many of their biggest moves for 2014 are already complete.

[adsenseyu2]

[adsenseyu4]

[subscribe2]

Best & Worst Contracts 2014: Atlanta Falcons

[adsenseyu1]

Week two of our Best & Worst series starts with the Atlanta Falcons

Best Contract: Roddy White

Roddy WhiteDespite an injury plagued 2013 season which saw Roddy White post very pedestrian numbers, there is no doubt that White has been a tremendous bargain for the Atlanta Falcons since signing a $42.72 million contract extension back in 2009. Since then White has produced four 1,000 yard seasons, three of which have been at least 1,296 yards. He has been instrumental in the development of QB Matt Ryan and never caused any contractual headaches despite being one of the most underpaid receivers in the NFL.

Whether the Falcons got lucky by extending White right before contracts began going over the top at the position or by being tough on the contract, they snagged White for pennies on the dollar. White had already proven that he was a high end caliber receiver with back to back seasons of at least 1,200 yards when he signed which should have been enough to grab a true game changing contract. By 2010 lesser players pushed the market beyond White and nowadays just having the potential to produce at this level would earn a player $12 million a year.

White would never carry a cap charge of more than $9.125 million in a season and overall the contract would be a solid structure for the Falcons. During his prime years between the ages of 28 and 31 White’s cap figures would range from $6.5 to $8 million. At the age of 33 White carries just a $6.325 million cap charge which would be a reasonable expectation for a player at that age. The team used a modest signing and option bonus which made him easy to release during either of the last two seasons of the contract if they needed. White’s deal also never contained the balloon payment structure that forces renegotiations and/or extensions

While there has been talk of extending White, the Falcons maintain leverage with the contract which should allow them to offer a modest priced contract that reflects his age.  As things stand White will play out his entire contract, which is a rarity in the NFL. That often is the sign of a very strong contract from the start. White has earned every penny of the contract while remaining one of the best bargains of recent times.

Worst Contract: Sam Baker

Sam BakerPart of me believes the Falcons’ front office has begun to move towards the thought process of playing solely for the present and paying less regard to negative future scenarios. That often happens to teams that are successful and trying to keep things running smoothly as they prepare to take the next step towards a championship. The Houston Texans followed a similar path with some extensions with little regard for the future and a focus solely on the present. The Texans fell apart and Atlanta will hope they don’t follow suit when they try to rebound from an injury filled 2013. While the team has few, if any, outlandish contracts the structures that they are using requires the players to maintain a strong level of play over a few year period to justify the charges.

Like I said last season, I don’t think Sam Baker is a bad player, the contract is just a bit of a reach on a player that should never have been considered a core player. The Falcons followed their typical procedure with the signing and option bonus payment, but in Baker’s case that 6th contract year is all about early contract salary cap reduction rather than true contract flexibility. It’s more of less no different than a voidable year. The $14 million in bonus payments also makes a very player friendly contract structure.

I think the comparison in Baker’s case was Will Beatty of the Giants. Both were decent players at important positions who tried to inch as close as possible to top mid-tier money. Baker will earn less overall than Beatty but has a better contract structure with nearly 66% of his five year value being paid in the first three years compared to Beatty’s 64%. Neither player gave the team injury protections, which arguably should have come in both contracts.

The bigger difference comes in the use of bonus money. Beatty received $12 million prorated over five years giving the Giants the ability to release him with $5 million remaining in acceleration come 2016, which represents around $4 million in cap savings. Baker will carry $6.4 million at the same time and only save the team about $1.6 million. That number I believe does a good job at protecting Baker’s four year contract value of $28 million while Beatty could be gone after three years and $24 million.

The contract looks worse now because Baker missed 12 games in 2013 and it reminded people of some injuries he has suffered throughout his career. It’s not that bad of a contract but its one in which the team could have gotten better protection and/or more cap flexibility. If Baker struggles in 2014 this is a contract that will likely be a focus of discussions concerning the Falcons moving forward especially since the Falcons spent a high draft pick on an offensive lineman, perhaps conceding the mistake that was made with Baker.

2013’s Best and Worst Falcons Contracts:

2013 Best Contract: Roddy White (In final year of contract- see above)

2013 Worst Contract: Sam Baker (Starting tackle Signed extension with Raiders-See above)

Click Here to Check out OTC’s other Best and Worst Contracts from around the NFL!

[adsenseyu2]

[adsenseyu4]

Contract Year Series, Matt Ryan

[adsenseyu1]

Matt Ryan #2 QB, Atlanta Falcons

by Paul Carrozzo

On July 9th, Matthew Stafford signed a 5 year $76.5 million contract with the Detroit Lions.  That signing along with the rumors leading up to the signing put Matt Ryan back on the mind. After watching the Baltimore Ravens gamble and lose with Joe Flacco, the question on most fans minds is how soon Matt Ryan’s contract will be extended by the Falcons.  Ryan is in the final year of his rookie contract (6 year $67.5 million) and is in position to really break the bank on his next contract.

We must remember where the Falcon franchise was in 2008 when they drafted Ryan 3rd overall.  The Mike Vick disaster had the club searching for a new face that it could be proud.  Matt Ryan was the man that not only pulled the Falcons out of the depths of public outcry, but it can be argued that the Falcons are now completely distanced from the incident because of Ryan.  How can something as unprecedented as this be valued?  It really is up to the Falcon brass to weigh in, but my assumption is that the Falcons will not go into the season without extending Ryan.

Oddly enough, it is the contract that Vick signed with the Eagles in 2011 that most closely resembles Ryan’s present value.  Add that skill valuation with the goodwill he has created in Atlanta, and it is a recipe for a Top 5 QB contract.

Estimated New Contract: 5 years, $86 million