Salary cap research, at least outside of an NFL organization, is pretty much an empty field. It’s understandable as salary cap numbers were always something that would be briefly mentioned in an article about a team and were not exactly public knowledge. There were more resources when various salary cap sites doing their best to track their favorite teams began springing up. I believe Miguel’s Patscap.com was the first site. Ian Whetstone, who contributes to OTC from time to time, kept (and still keeps) these great word docs and spreadsheets detailing salary cap reports from various sources. And with sites such as OTC now there is more ability to do research on current trends. But historical data is still a tough subject to come by.
For this series of posts I wanted to get together as much accurate historical data as I could and start looking at just how Super Bowl champions spend their salary cap dollars in building a championship team. So for this series we will go all the way back to 1994 and look at how each Super Bowl team was built. My focus is on top of the roster spending because that is the area that eats up essentially half a teams’ budget and is what we discuss the most on the site.
In part 1, which is today’s entry, we are going to look at the percentage of adjusted salary cap spent on the top player, top 3 players, top 5 players, and top 10 players on a roster. In part 2 we will look at the positional allocations among the teams. Finally in part 3 we’ll take a look at these trends and apply them to today’s NFL and see which teams most closely resemble the salary cap construction of Super Bowl champions.
There are a few things to keep in mind about the numbers. One is that the 2010 Green Bay Packers are not included because the year had no salary cap and thus there is no basis to rate their salary cap spending. The second is that, when discussing the spending I will be eliminating the 1997 and 1998 Denver Broncos from the discussion. I’ll include a separate section to explain that later in this post..
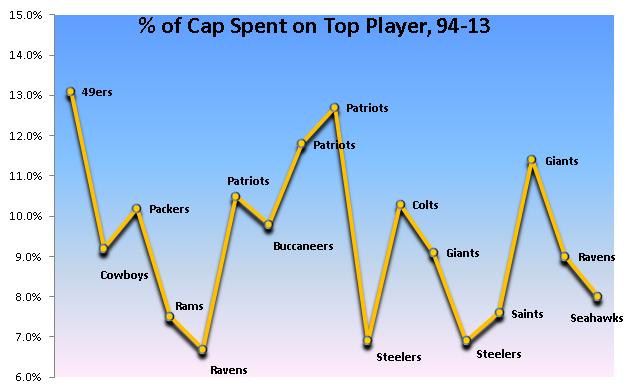
Top Player Salary Cap Spending
Average Spend: 9.5%
Largest Spender: 13.1% (Steve Young- 1994 49ers)
Lowest Spender: 6.7% (Jon Ogden- 2000 Ravens)
Just 7 of the 17 Super Bowl Champions of the salary cap era spent more than 10% of their entire salary cap on their highest priced player, with four of those teams coming between the 2001 and 2006 seasons (all three Patriots champions and the 2006 Colts). In general the trend has been towards less spending in recent years with 6 of the lowest spenders having come post 2005. I would tend to think that this could be due to teams putting more of an emphasis on drafting than veteran free agent starters, though it could also be teams being more effective for one year manipulation of the salary cap.
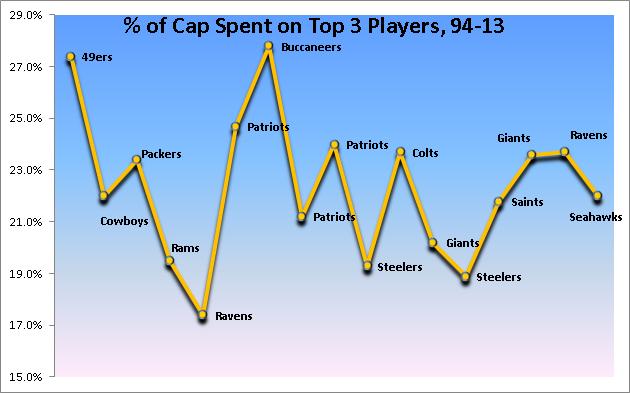
Top 3 Salary Cap Spending
Average Spend: 22.4%
Largest Spender: 27.8% (Warren Sapp, Brad Johnson, & Simeon Rice- 2002 Buccaneers)
Lowest Spender: 17.4% (Ogden, Ray Lewis, & Michael McCrary- 2000 Ravens)
I was a bit surprised to see the Tampa Bay Buccaneers team rank so high since everyone associates Brad Johnson with journeyman QB, but he was highly enough compensated along with two defensive stars to push
them to the top of the list. Not surprisingly the Ravens were at the bottom as Trent Dilfer was paid more like a journeyman with just a $1 million cap hit. We have a nice spread of data here with some current teams over the average and some under the average.
I think two of the surprises are the Patriots’ 2001 and 2004 teams. These are squads that are associated with reasonable priced QB play, but all the Patriots teams had big money invested in Ty Law and the two teams had money invested in QB- by 2004 Brady had signed a pricier extension and in 2001 Drew Bledsoe was a big earner. NE overcame a lot of salary cap waste those years to win their Super Bowls. In 2001 Bledsoe was injured and replaced and in 2004 Law only played in 7 games while their third highest cap charge came from Lawyer Milloy, a player who was released a few days before the season began.
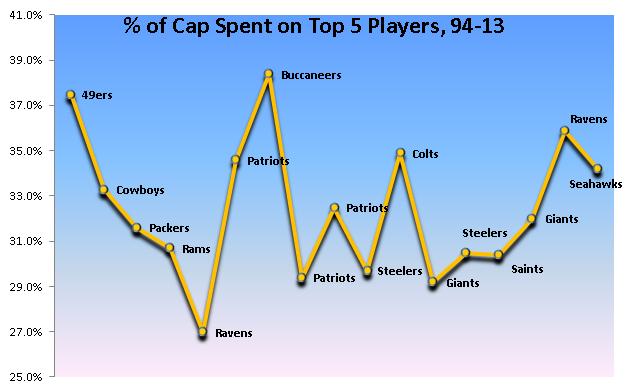
Top 5 Salary Cap Spending
Average Spend: 32.5%
Largest Spender: 38.4% (Sapp, Johnson, Rice, Derrick Brooks & Jeff Christy- 2002 Buccaneers)
Lowest Spender: 27.0% (Ogden, Lewis, McCrary, Rod Woodson, & Peter Boulware- 2000 Ravens)
On average teams allocated about 33% of the entire salary cap to just 5 players. Our two most recent NFL champions both rated above the average which was a slight jump for both teams indicating that their GMs believed in continuous spending rather than drop-offs after the top few players. In light of the last category it is not surprising to see the Bucs and Ravens rate highest and lowest. The Bucs were a veteran laden team that was near the end of their run with Jon Gruden being brought in as a replacement for Tony Dungy. The team would win just 12 games in the next two years and has been the worst futures performing Super Bowl champion, though the Giants look poised to take that title this year if they fail to advance to the playoffs. The Ravens were the very young group with a number of contributing top draft picks on the team and made the playoffs in two of the next three years, so they did better than the Bucs, but were actually towards the bottom of the list in future playoff success as well.
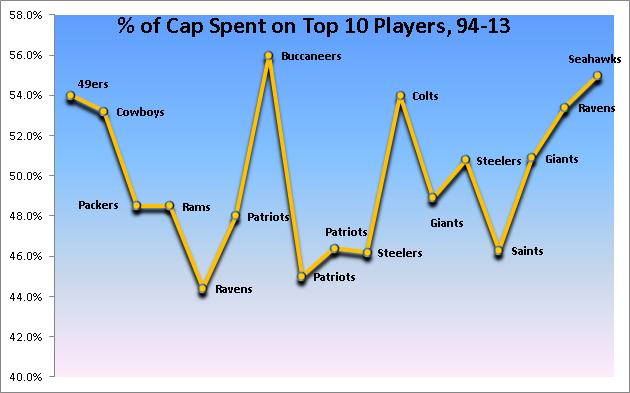
Top 10 Salary Cap Spending
Average Spend: 50.0%
Largest Spender: 56.0% (2002 Buccaneers)
Lowest Spender: 44.4% (2000 Ravens)
It certainly pays to be considered a good player, as Super Bowls champions invest half of their budget on less than 20% of the players on the team. One of the interesting takeaways here is that the Seahawks ranked 2nd out of 17 teams with 55% of the cap being allocated on 10 players. I think this actually goes against the popular thought about the way the team was constructed. Because the Seahawks get so much mileage out of their young talent people but this was a team that spent on veteran talent. It shows the impact of the draft on a team as they received little from Zach Miller, Sidney Rice, and Percy Harvin and others were released this season for cap considerations.
In general the more recent trends have pushed towards lower spending on the top player on the roster with increased spending on the “above average” talent base. Since 2006 only the 2009 Saints spent less than 48.9% on their top 10 players. Perhaps the most interesting teams were the Patriots dynasty teams that were big spenders up to the top 3 players, but ended up among the bottom 6 in the top 10 category.
[adsenseyu2]
Overall Spending Breakdowns
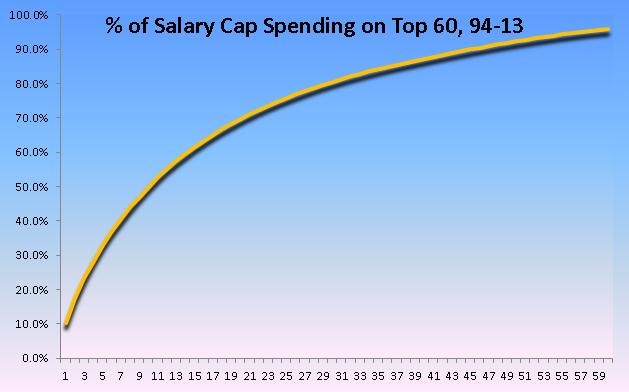
I just wanted to take a small sampling of the teams to see how the league spends so much on so few players. Though there will be some differences in how teams are built, once you extend rosters out to 60+ players (these include terminated contracts obviously) we can see that about 75% of funding is spent on just 25 players and 80% of all funding on just 30 players. That is essentially our starting roster and it is why I often talk about roster turnover every year and how almost nobody is safe. If you are not an entrenched starter you either need to show potential to be one or bring value added services (special teams, multiple positions, specialized packages) to keep from getting your number called in the final days of the preseason.
So Why No Broncos?
The 1997 and 1998 Broncos are one of the more well remembered champions of recent NFL history primarily because of the storybook ending to the career of John Elway. But this was still the earliest days of the salary cap and certain teams in the NFL were always finding ways to try to cheat the salary cap. Some violated the spirit of the CBA (I think every early CBA seemed to have some type of prior Dallas Cowboys loophole closed), but the Broncos remain were found in violation of the salary cap and were fined years later for these violations.
The general nature of the violations, which were found to run from 1996 to 1998, surrounded deferring large payments for star players like Elway. There were other types of guaranteed bonuses being promised to players to avoid proration treatment of the bonuses. Denver claimed that these maneuvers were simply done because they were having cash flow problems and that no benefit was gained despite the league penalties.
When tabulating the data it just felt wrong to agree with that assessment. The 5.5 and 5.3% that was spent on their top player was at least 1.2% less than the next closest teams. Their top 10 spending in 1997 was just 40.2%, 4% less than the 2000 Ravens. What those numbers are not so ridiculous, to expect a team with a Hall of Fame veteran QB to be playing for pennies is.
Elway’s cap charges in the Super Bowl seasons were just $2.1 and $2.6 million respectively. By comparison Dan Marino, who would be the most logical comparison, had cap charges of $4.3 and $7.6 million. Troy Aikman’s cap charges were both over $5 million in those seasons. Some may argue that Steve Young had low cap charges ($3.5 million), but that was also a team found in violation of the cap. So for the purposes of this study it just did not seem relevant to include this group as a reasonable way to look at building a team especially in light of the violations they were found guilty of.
[adsenseyu6]
Future Success
I wanted to also look at how the team performed in the three year period following the Super Bowl. Ranking them was solely based on playoff success with a team being awarded 10 points for winning a Super Bowl, 8 points for losing a Super Bowl, 6 points for the conference championship, and so on. Since we are going in a three year period we have limited our pool by three more teams.
The average score was 10.85 with a median of 10. The teams who invested heavily in one player were the teams who had the most success in the future. The 49ers, Patriots dynasty, and Manning Colts all were big playoff successes in the future. That slowly begins to shift as we move to top 10 spending as you get three of the lowest five in the top 6 of spending and four of the best teams in the bottom 6.
The following chart shows the salary cap spending for each of the teams discussed including the Denver Broncos. Clicking on the headers should allow you to change the sorting method. In our next part of the series we’ll see exactly where this money was spent.
| Year | Team | Top 1 | Top 3 | Top 5 | Top 10 |
| 1994 | 49ers | 13.1% | 27.4% | 37.5% | 54.0% |
| 2004 | Patriots | 12.7% | 24.0% | 32.5% | 46.4% |
| 2003 | Patriots | 11.8% | 21.2% | 29.4% | 45.0% |
| 2011 | Giants | 11.4% | 23.6% | 32.0% | 50.9% |
| 2001 | Patriots | 10.5% | 24.7% | 34.6% | 48.0% |
| 2006 | Colts | 10.3% | 23.7% | 34.9% | 54.0% |
| 1996 | Packers | 10.2% | 23.4% | 31.6% | 48.5% |
| 2002 | Buccaneers | 9.8% | 27.8% | 38.4% | 56.0% |
| 1995 | Cowboys | 9.2% | 22.0% | 33.3% | 53.2% |
| 2007 | Giants | 9.1% | 20.2% | 29.2% | 48.9% |
| 2012 | Ravens | 9.0% | 23.7% | 35.9% | 53.4% |
| 2013 | Seahawks | 8.0% | 22.0% | 34.2% | 55.0% |
| 2009 | Saints | 7.6% | 21.8% | 30.4% | 46.3% |
| 1999 | Rams | 7.5% | 19.5% | 30.7% | 48.5% |
| 2008 | Steelers | 6.9% | 18.9% | 30.5% | 50.8% |
| 2005 | Steelers | 6.9% | 19.3% | 29.7% | 46.2% |
| 2000 | Ravens | 6.7% | 17.4% | 27.0% | 44.4% |
| 1997 | Broncos | 5.5% | 16.2% | 24.3% | 40.2% |
| 1998 | Broncos | 5.3% | 15.6% | 25.3% | 44.1% |
| Average (w/o Den) | 9.5% | 22.4% | 32.5% | 50.0% | |
| Average (w/Den) | 9.0% | 21.7% | 31.7% | 49.1% |
[adsenseyu2]
[subscribe2]
[adsenseyu4]