I have some podcasts and articles coming soon, so here are some more figures that will be referenced to often. Below are the offensive and defensive averages for all 12 playoff teams as well as the Super Bowl positional averages that I compiled last offseason.
Tweet me at @ZackMooreNFL with any questions that you want covered in the podcasts. The first one should be up this week as I’m putting together my notes on the 1997/1998 Broncos and how they have given the 2015 Broncos, and others, a Super Bowl blueprint to follow.
E-mail me at Caponomics@gmail.com if you want to join the e-mail list and be updated on when podcasts become available as well as my Caponomics book that *should* be out by March. It’s finished, just working on the process of editing it and publishing now.
Figure 1: Offensive Averages
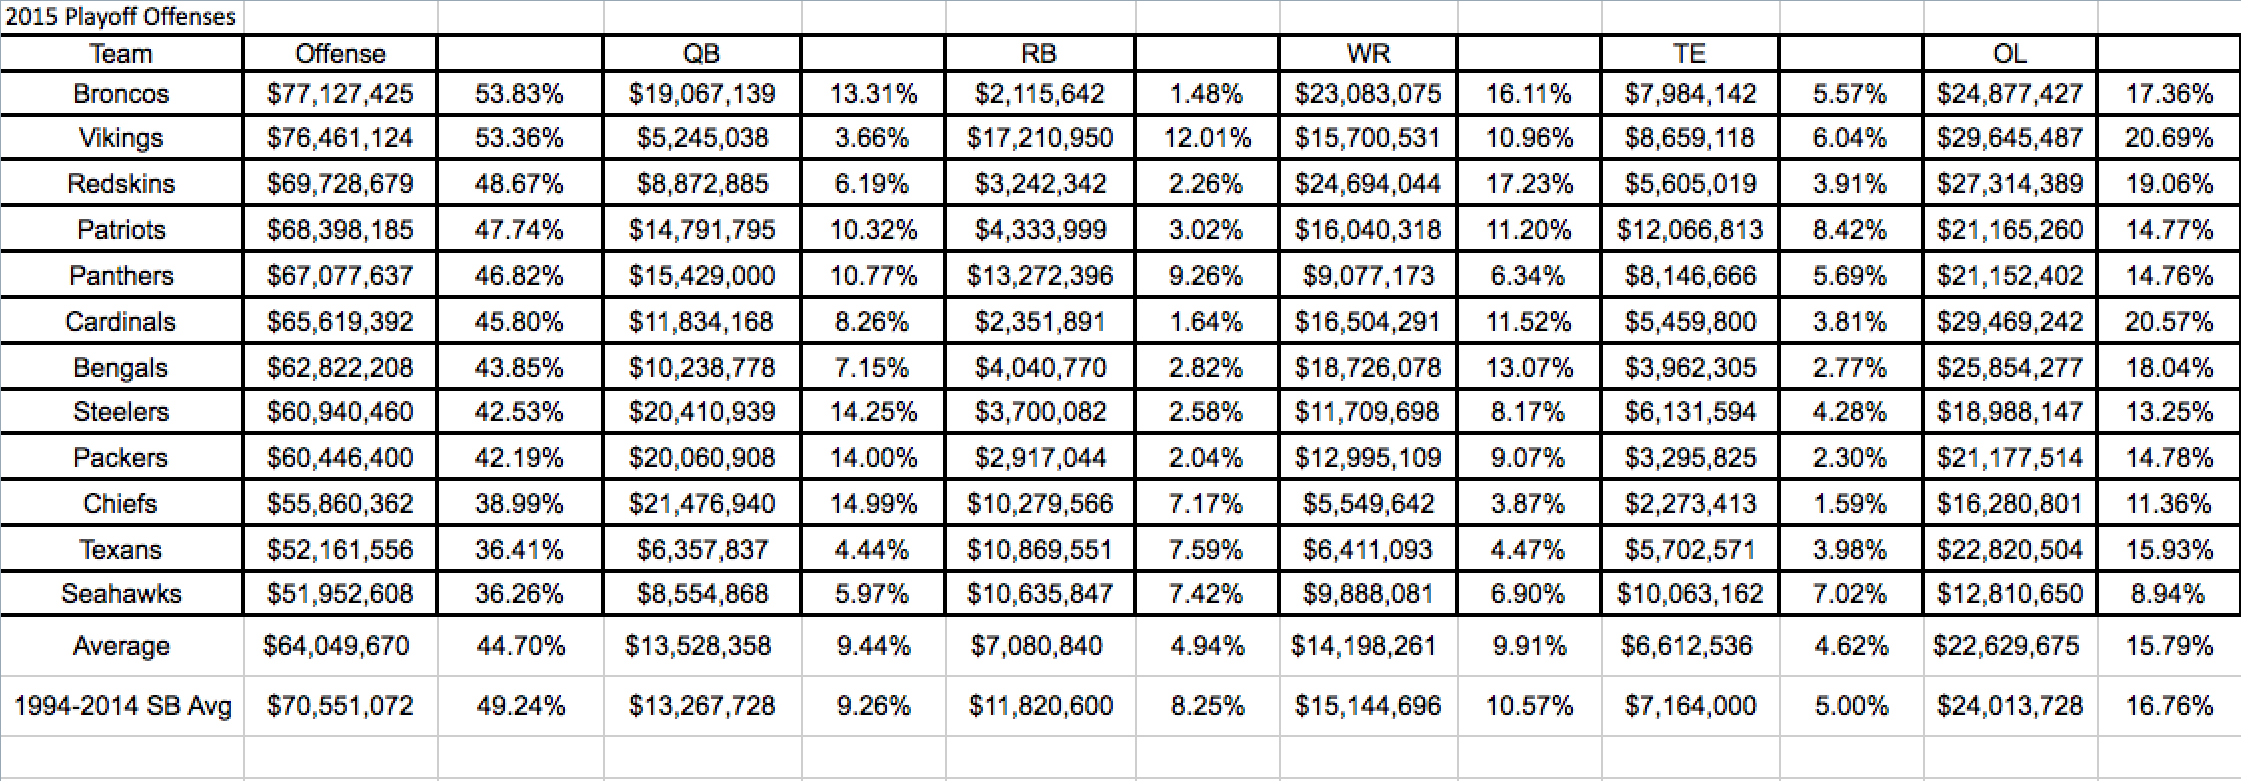
Figure 2: Defensive Averages
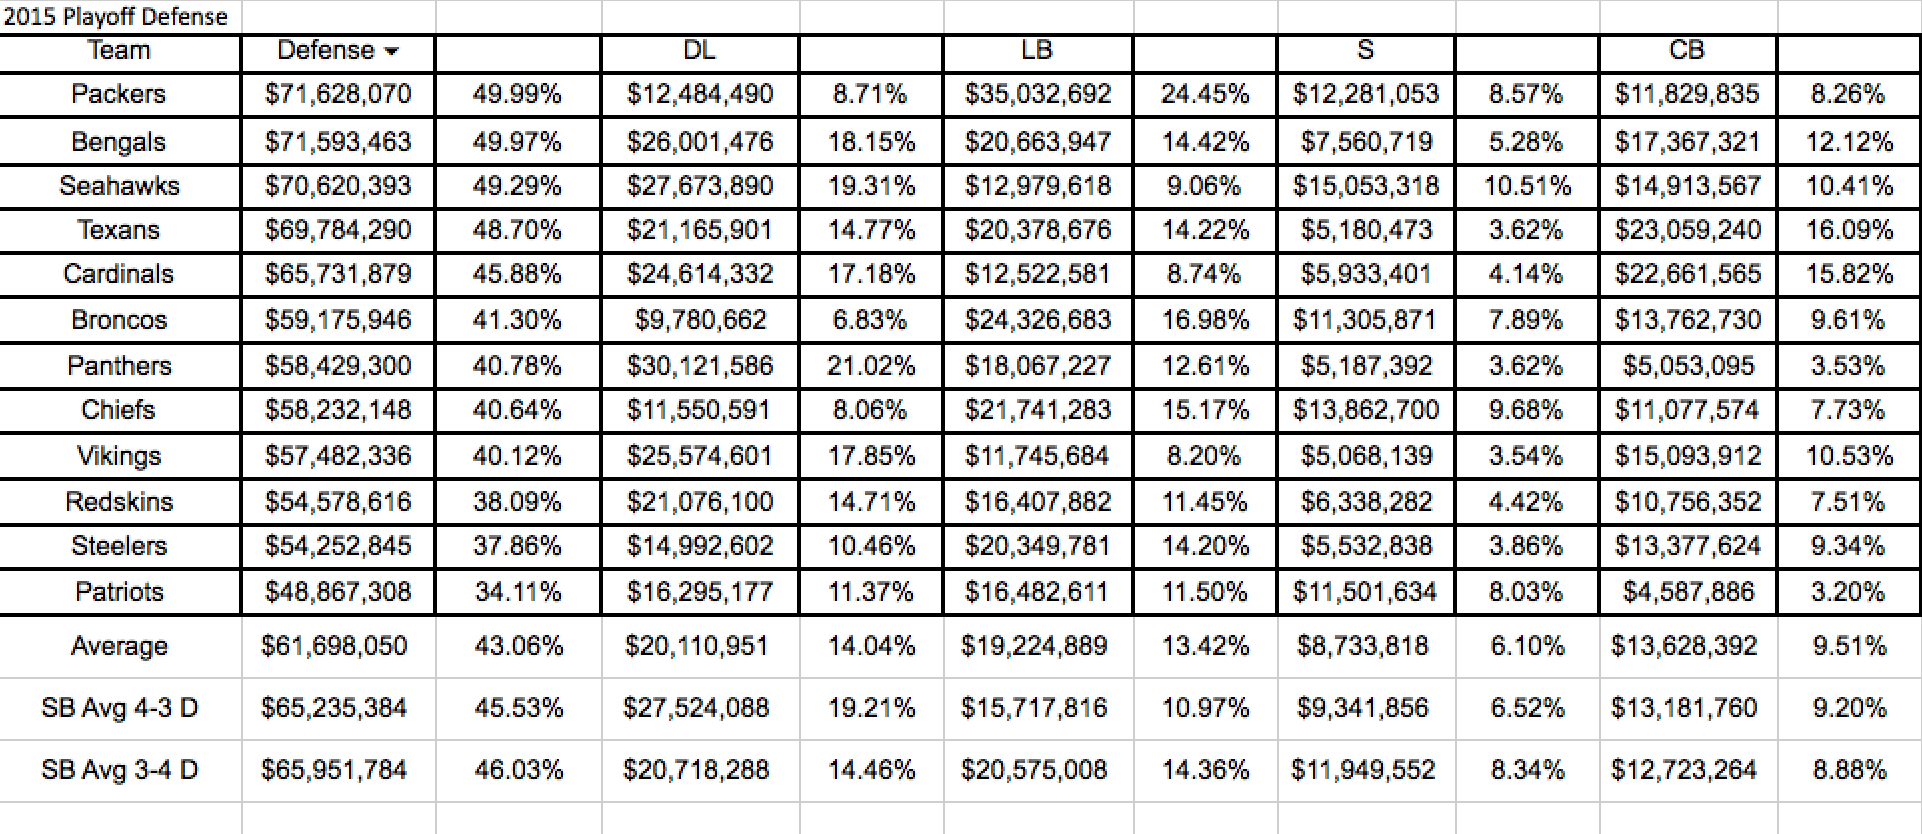
Figure 3: Super Bowl Offenses
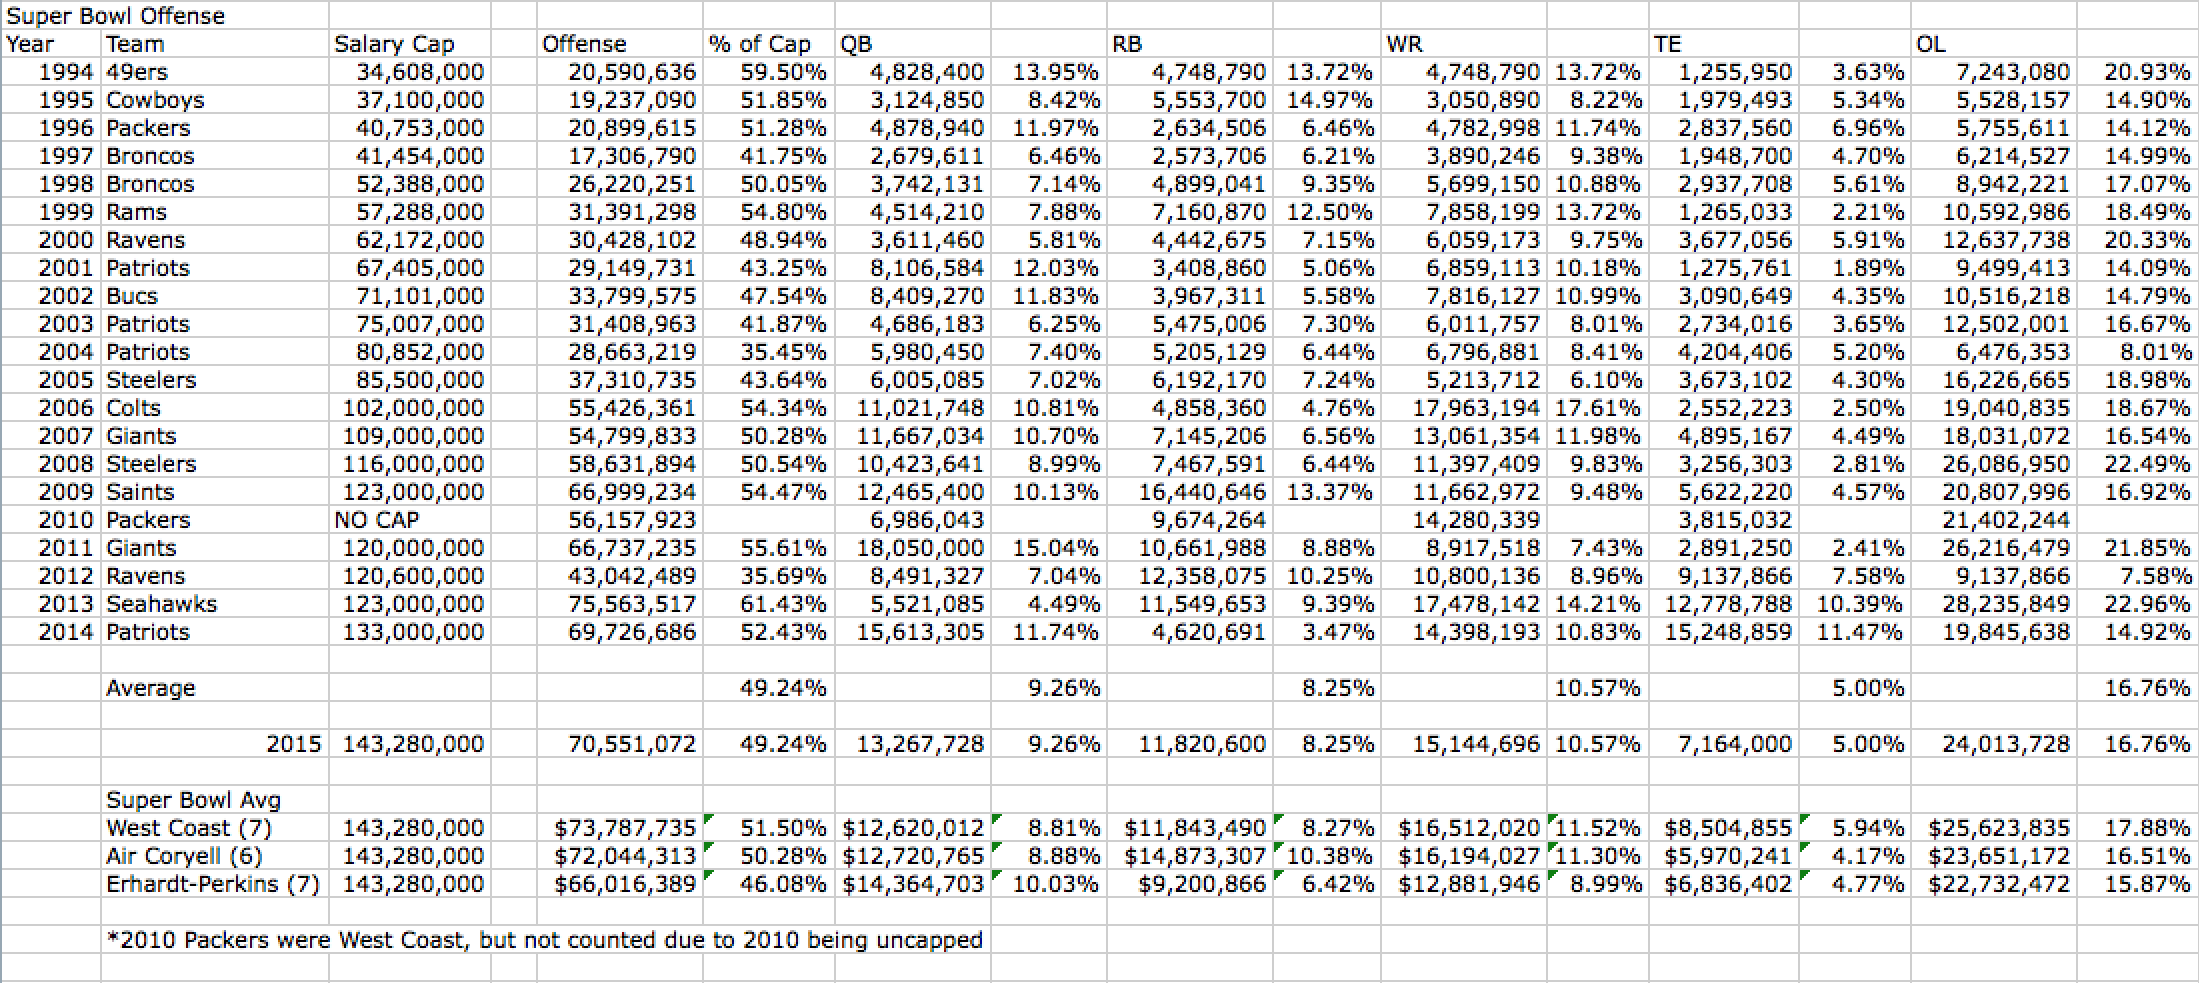
West Coast: 94 49ers, 96 Packers, 97/98 Broncos, 00 Ravens, 02 Bucs, 10 Packers, 13 Seahawks
Erhardt-Perkins: 01/03/04 Patriots, 05 Steelers, 07 Giants, 11 Giants, 14 Patriots
Air Coryell: 95 Cowboys, 99 Rams, 06 Colts, 08 Steelers, 09 Saints, 12 Ravens
Figure 4: Super Bowl Defenses
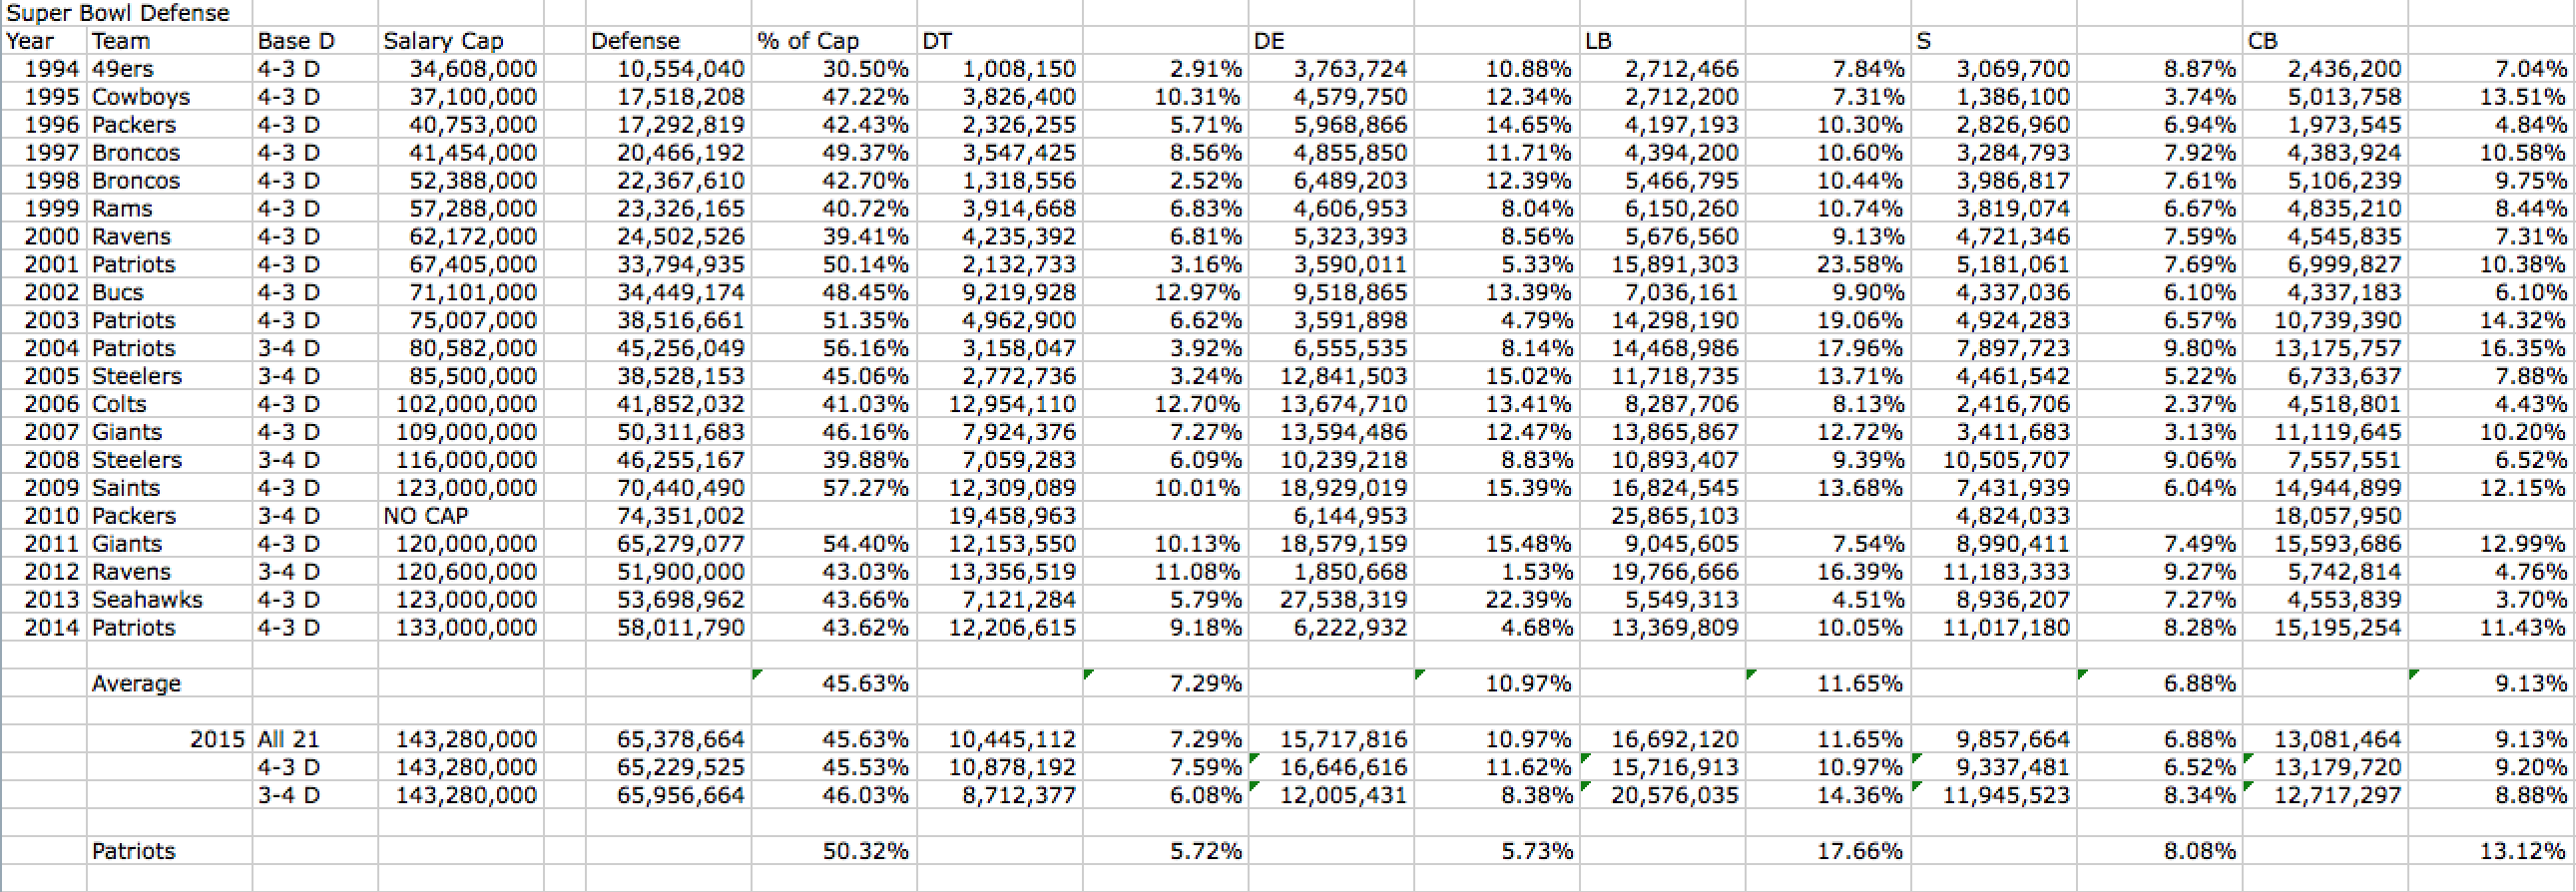
Figure 5: Super Bowl Specialists
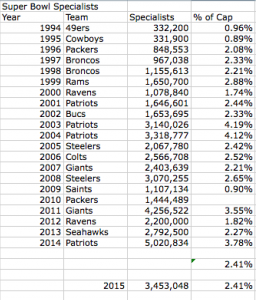
Figure 6: Total Team Spending
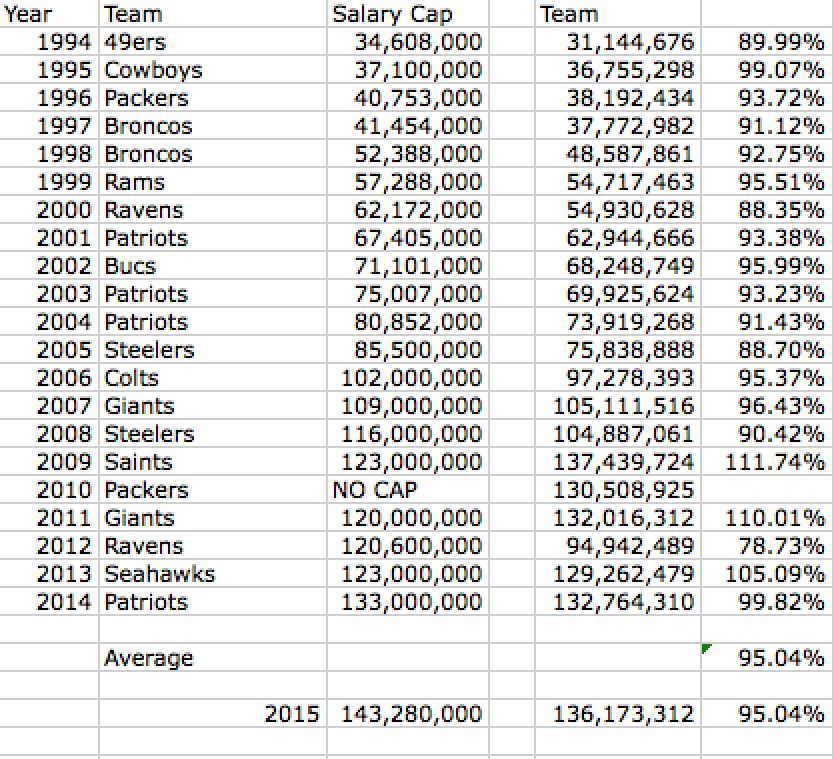
Figure 7: Offensive Stats for 2015 Playoff Teams
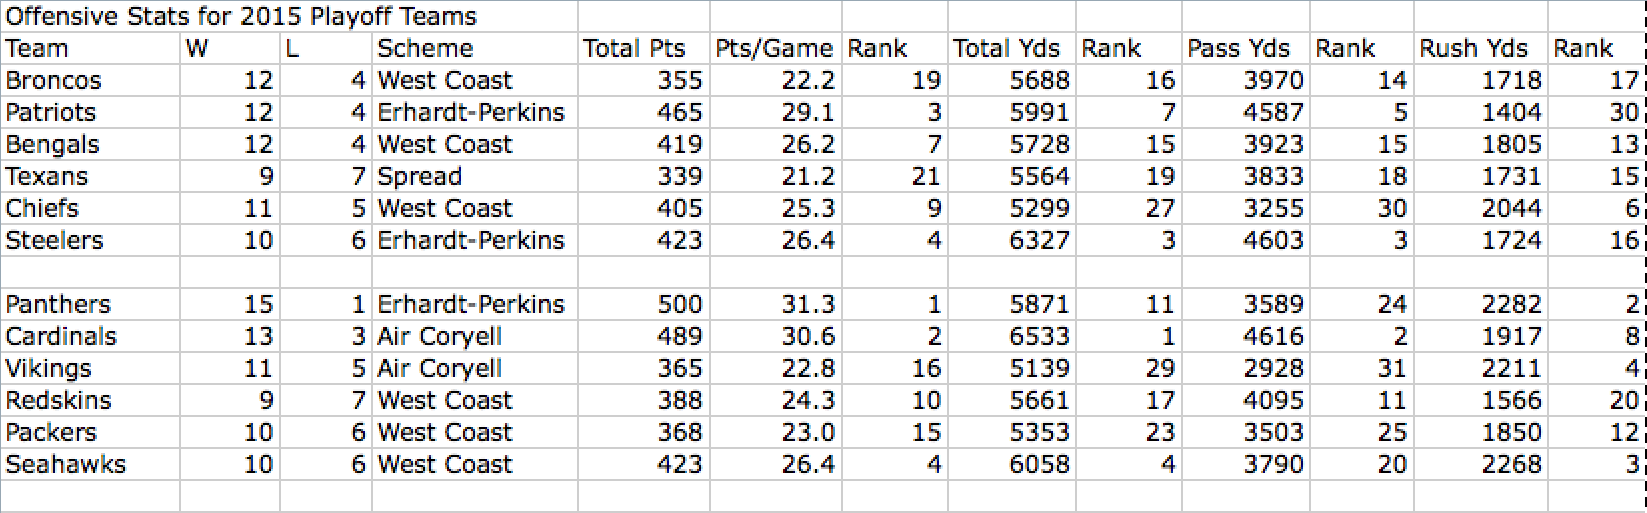
Figure 8: Defensive Stats for 2015 Playoff Teams
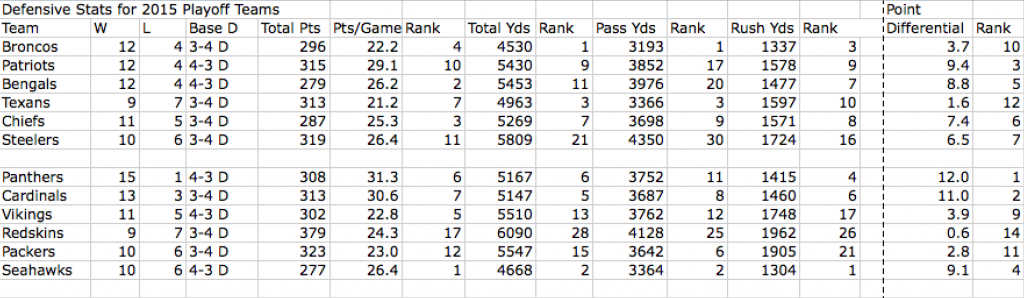
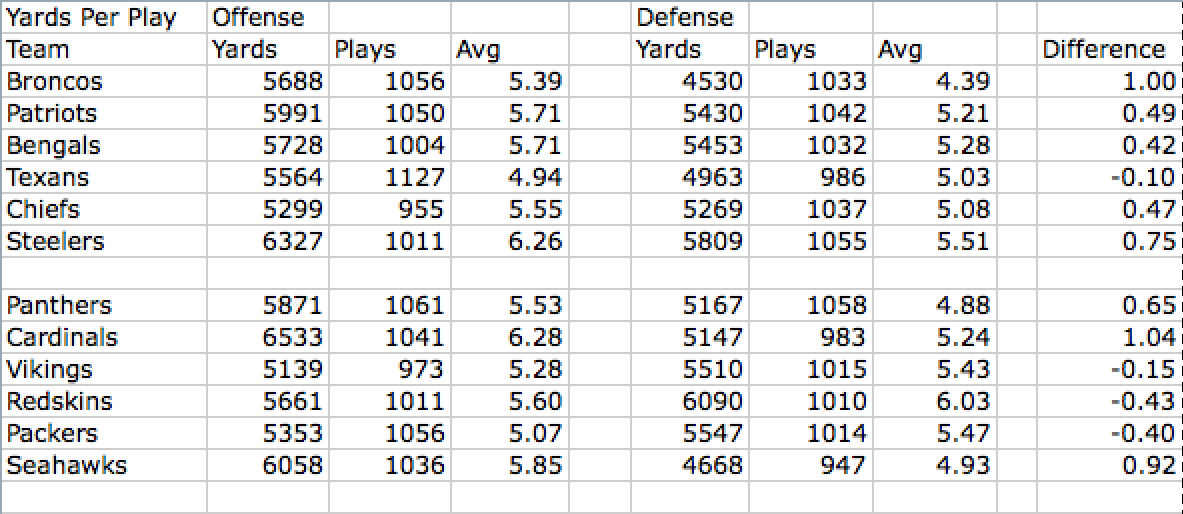
Figure 9: Yards Per Play for 2015 Playoff Teams